- Home >
- Stock Photos >
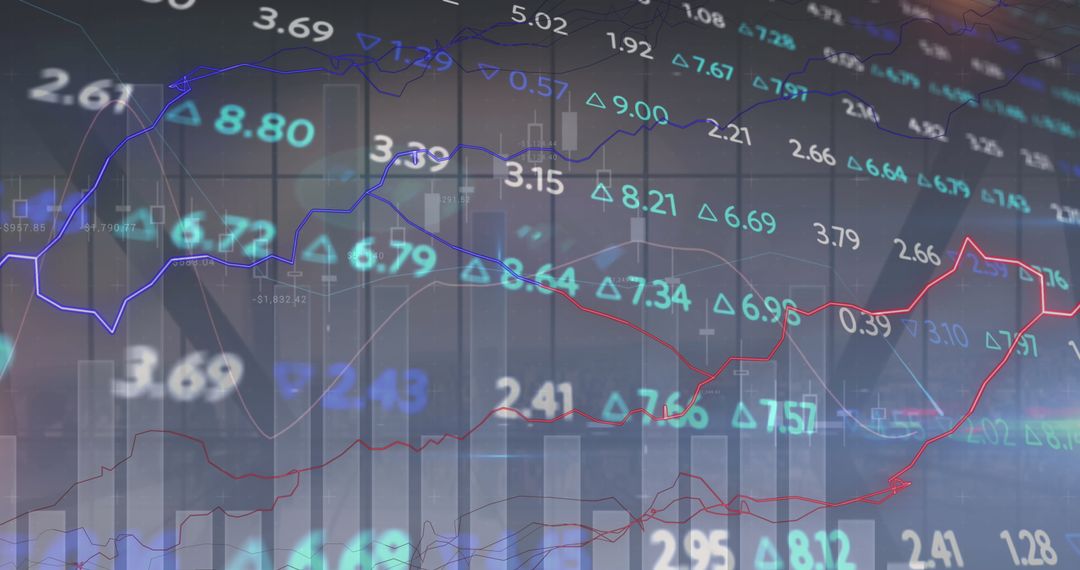
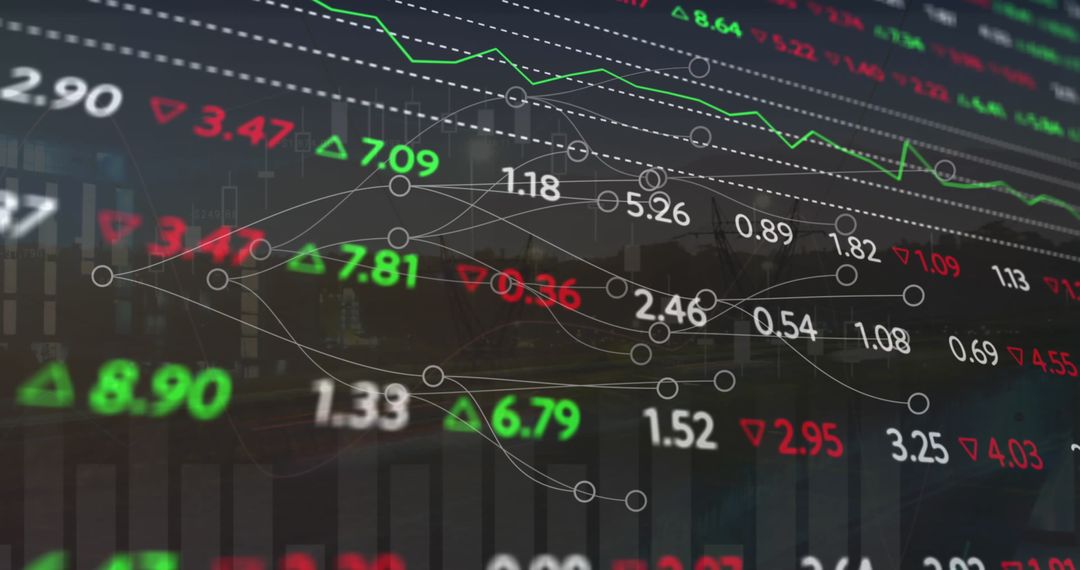
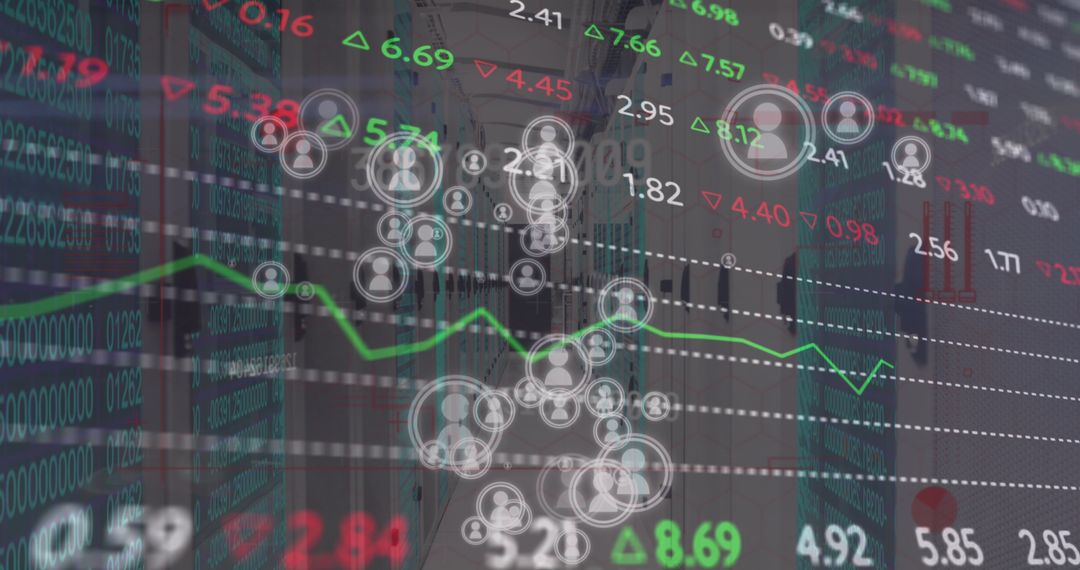
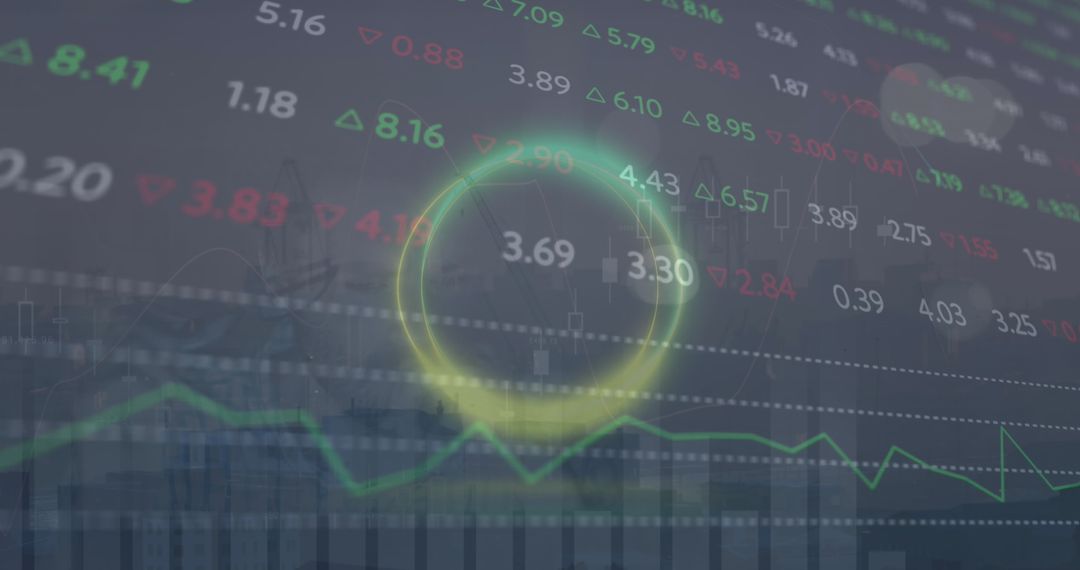
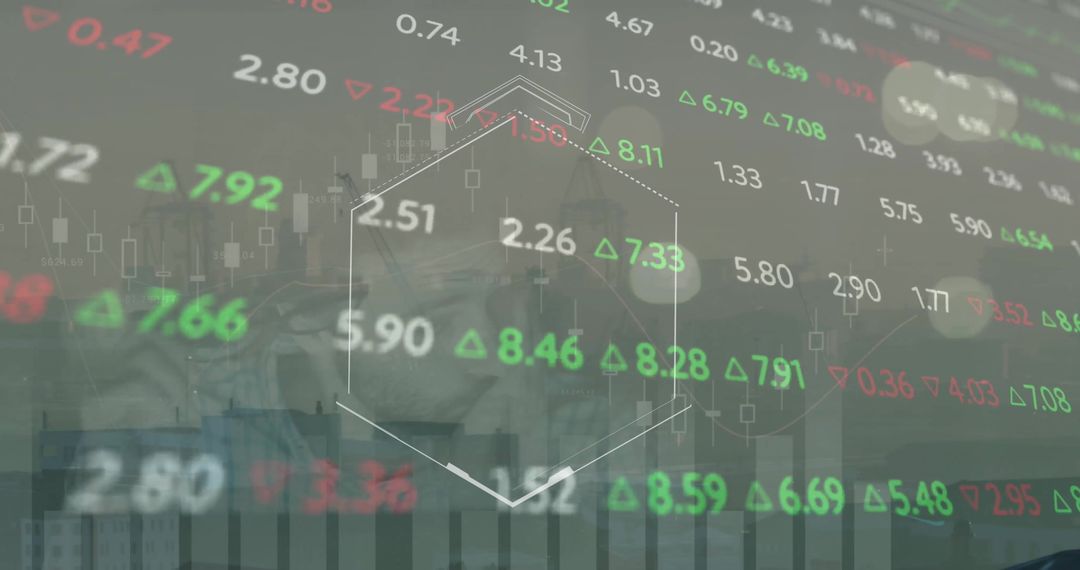
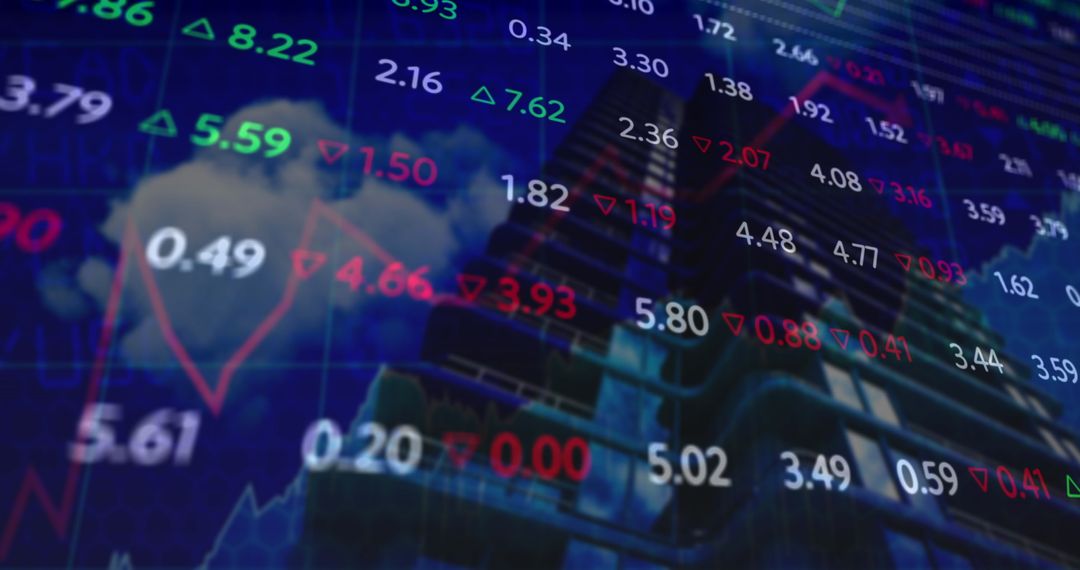
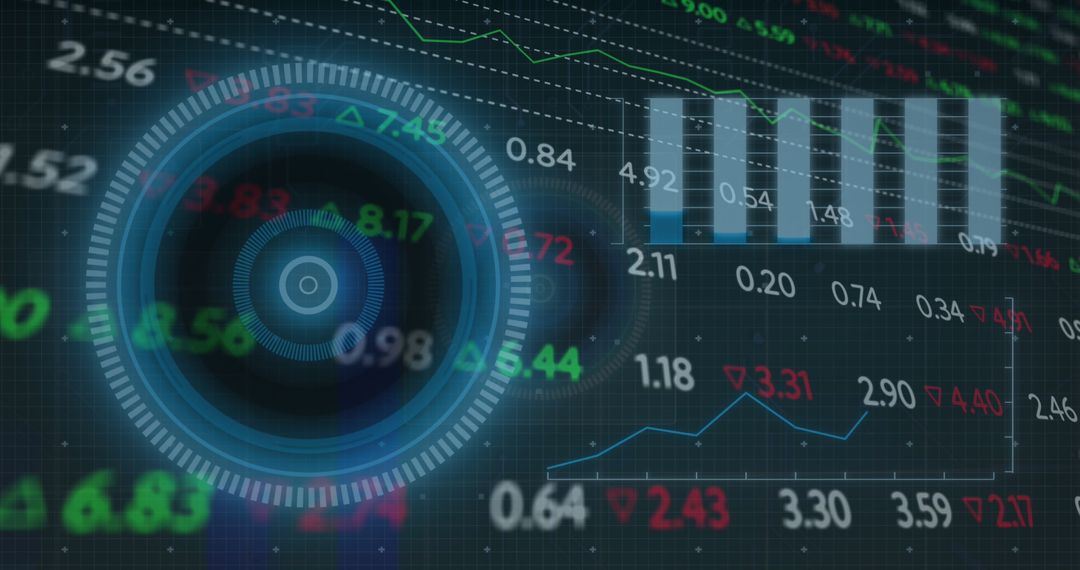
- Pandemic Impact on Financial Markets Visualization with Virus and Mask Icons
Pandemic Impact on Financial Markets Visualization with Virus and Mask Icons Image
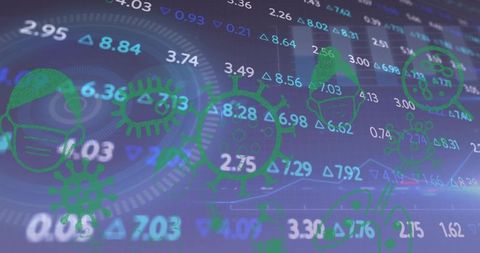
Foreground green virus and mask icons overlaying blue-toned financial dashboard with stock tickers, numeric deltas, circular gauges, and line graphs. Visual combining public health motifs with market data, representing pandemic-driven market volatility, risk analysis, and economic disruption. Suiting editorial coverage of pandemic impact on markets, financial reports, investor presentations, business articles, economic research, and healthcare economics analysis. Working well for headlines, website banners, social posts, slide decks, financial newsletters, and whitepapers. Colour palette supporting blue corporate themes with contrasting green icons for emphasis. Customization suggestions: cropping for header banners, adding headline text in empty space, adjusting opacity for layered branding, applying color grading to match corporate identity. Potential uses: illustrating market analysis during health crises, visualizing correlation between infection trends and stock performance, supporting risk management presentations, creating cover art for reports on pandemic economy.
Powered by  - Get 15% off with code: PIKWIZARD15


0
downloads
downloads
Tags:
More
Credit Photo
If you would like to credit the Photo, here are some ways you can do so
Text Link
photo Link
<span class="text-link">
<span>
<a target="_blank" href=https://pikwizard.com/photo/pandemic-impact-on-financial-markets-visualization-with-virus-and-mask-icons/a0a27d4a67e9dda5b6da9949cbe1bf03/>PikWizard</a>
</span>
</span>
<span class="image-link">
<span
style="margin: 0 0 20px 0; display: inline-block; vertical-align: middle; width: 100%;"
>
<a
target="_blank"
href="https://pikwizard.com/photo/pandemic-impact-on-financial-markets-visualization-with-virus-and-mask-icons/a0a27d4a67e9dda5b6da9949cbe1bf03/"
style="text-decoration: none; font-size: 10px; margin: 0;"
>
<img src="https://pikwizard.com/pw/medium/a0a27d4a67e9dda5b6da9949cbe1bf03.jpg" style="margin: 0; width: 100%;" alt="" />
<p style="font-size: 12px; margin: 0;">PikWizard</p>
</a>
</span>
</span>
Free (free of charge)
Free for personal and commercial use.
Author: Authentic Images
Similar Free Stock Images

Premium


Premium


Premium

Premium


Premium


Premium


Premium


Premium


Premium


Premium


Premium


Premium


Premium


Premium

Premium


Premium


Premium


Premium


Premium


Premium


Premium


Premium


Premium


Premium