- Home >
- Stock Photos >
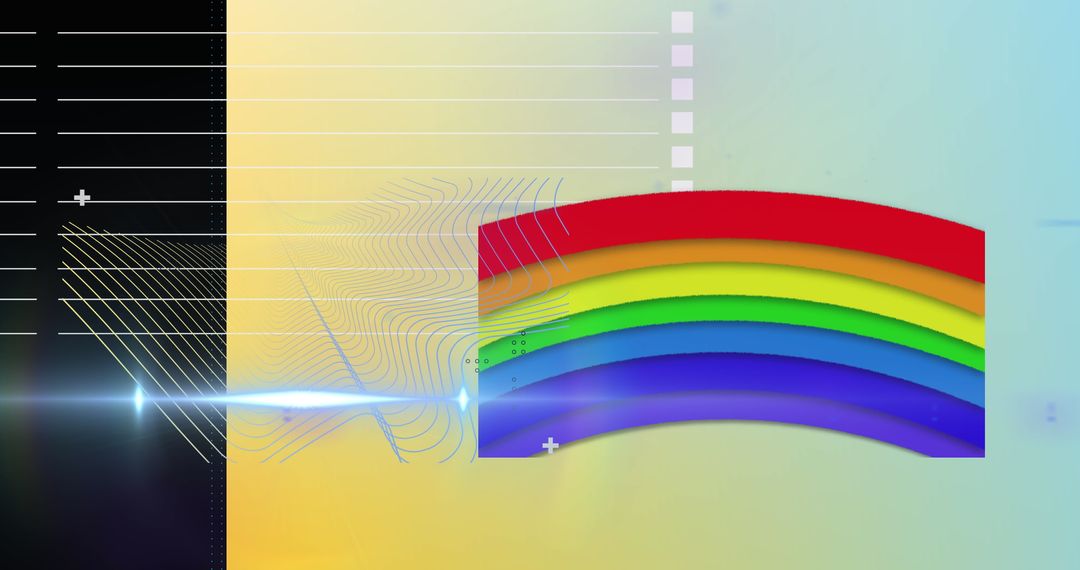
- Pastel Bar Graph With Translucent Bars on Colorful Overlay Background
Pastel Bar Graph With Translucent Bars on Colorful Overlay Background Image
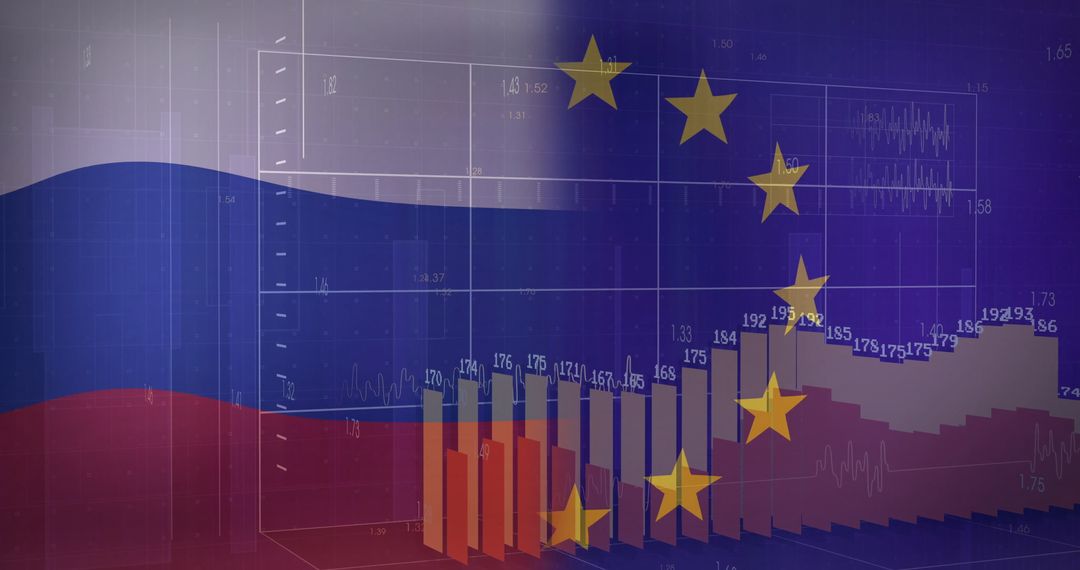
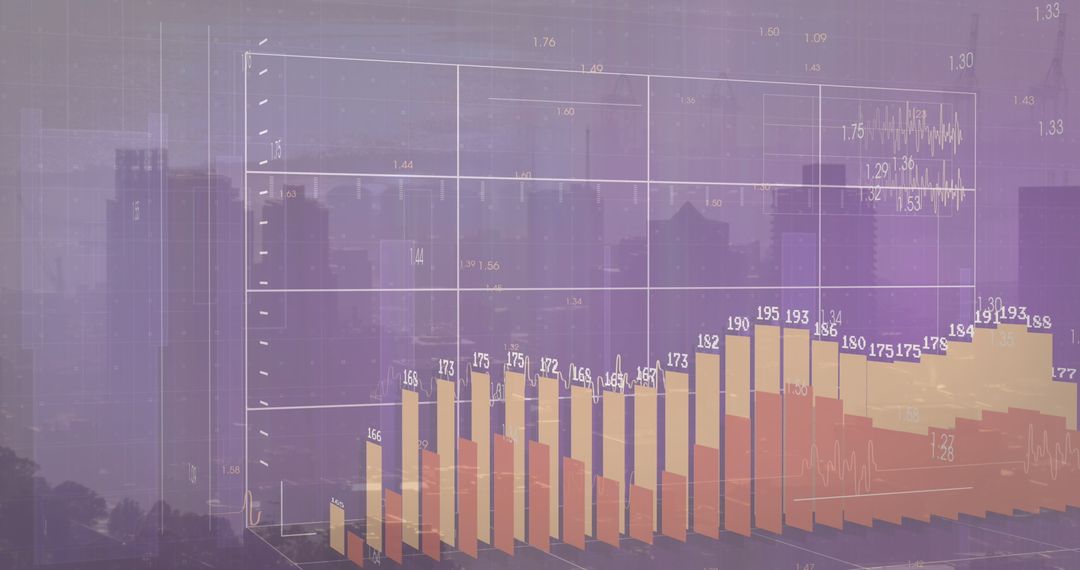
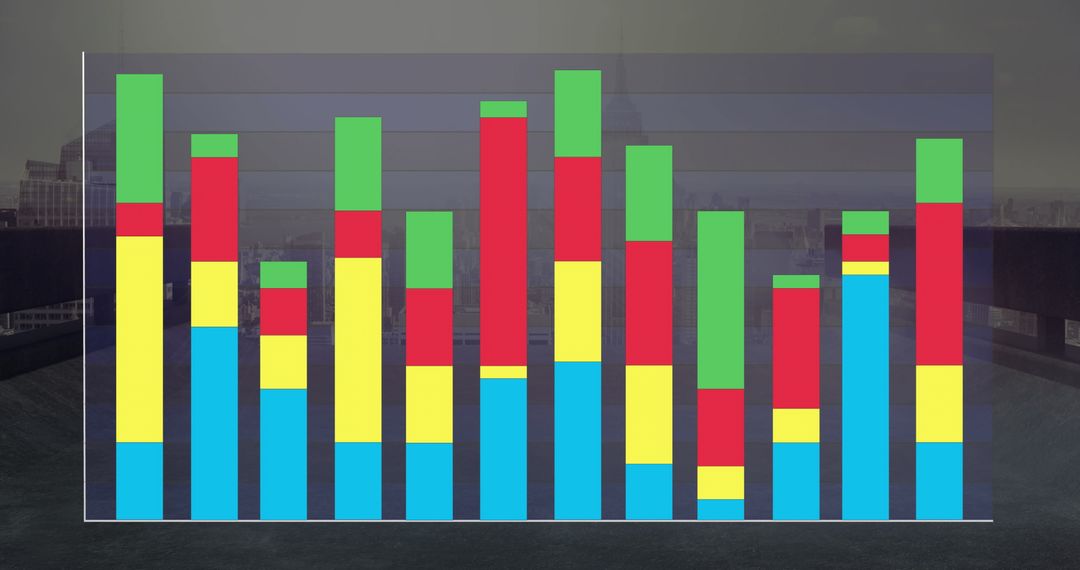
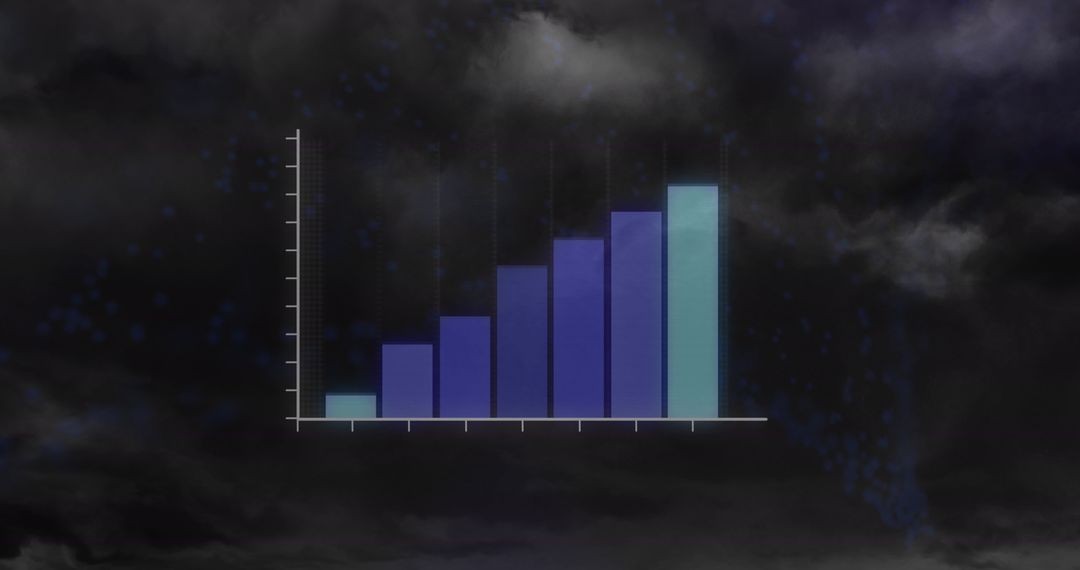
Pastel bar graph visualizing dynamic data against multicolored, abstract shapes on digital display. Useful for presentations on business intelligence, visual communication, data trends, and technological branding aesthetics.
Powered by  - Get 15% off with code: PIKWIZARD15


0
downloads
downloads
Tags:
More
Credit Photo
If you would like to credit the Photo, here are some ways you can do so
Text Link
photo Link
<span class="text-link">
<span>
<a target="_blank" href=https://pikwizard.com/photo/pastel-bar-graph-with-translucent-bars-on-colorful-overlay-background/d5471d30ece148040b88f6382d014031/>PikWizard</a>
</span>
</span>
<span class="image-link">
<span
style="margin: 0 0 20px 0; display: inline-block; vertical-align: middle; width: 100%;"
>
<a
target="_blank"
href="https://pikwizard.com/photo/pastel-bar-graph-with-translucent-bars-on-colorful-overlay-background/d5471d30ece148040b88f6382d014031/"
style="text-decoration: none; font-size: 10px; margin: 0;"
>
<img src="https://pikwizard.com/pw/medium/d5471d30ece148040b88f6382d014031.jpg" style="margin: 0; width: 100%;" alt="" />
<p style="font-size: 12px; margin: 0;">PikWizard</p>
</a>
</span>
</span>
Free (free of charge)
Free for personal and commercial use.
Author: Awesome Content
Similar Free Stock Images

Premium


Premium


Premium


Premium


Premium


Premium


Premium


Premium


Premium


Premium


Premium


Premium


Premium


Premium


Premium


Premium


Premium


Premium


Premium


Premium


Premium


Premium


Premium


Premium