- Home >
- Stock Photos >
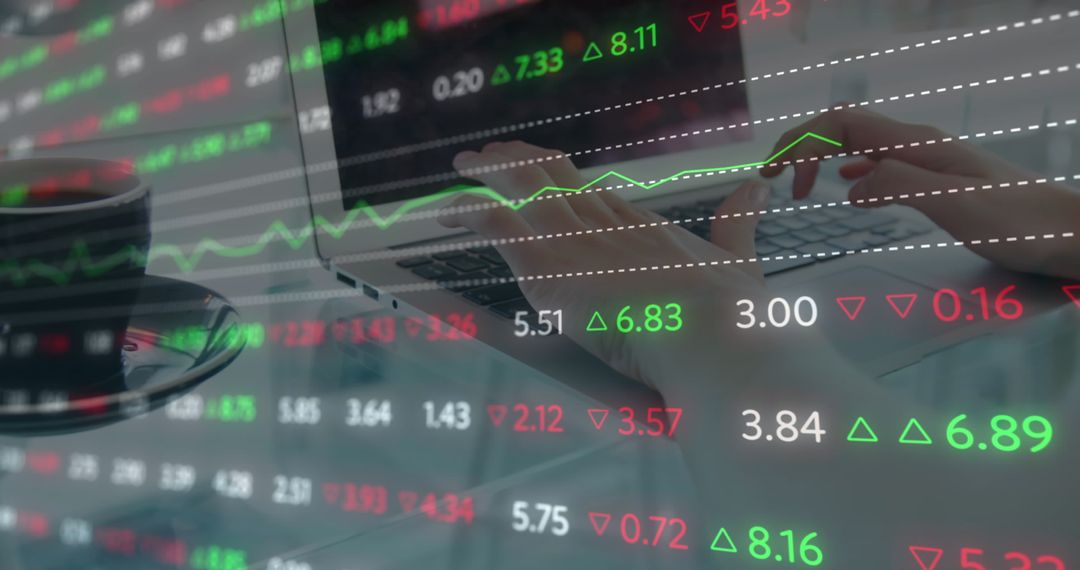
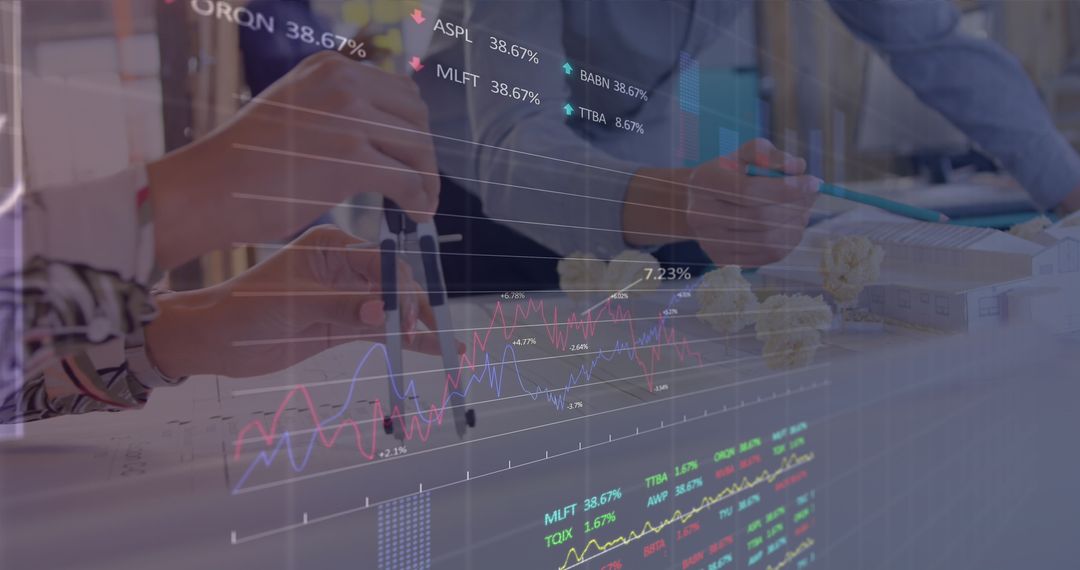
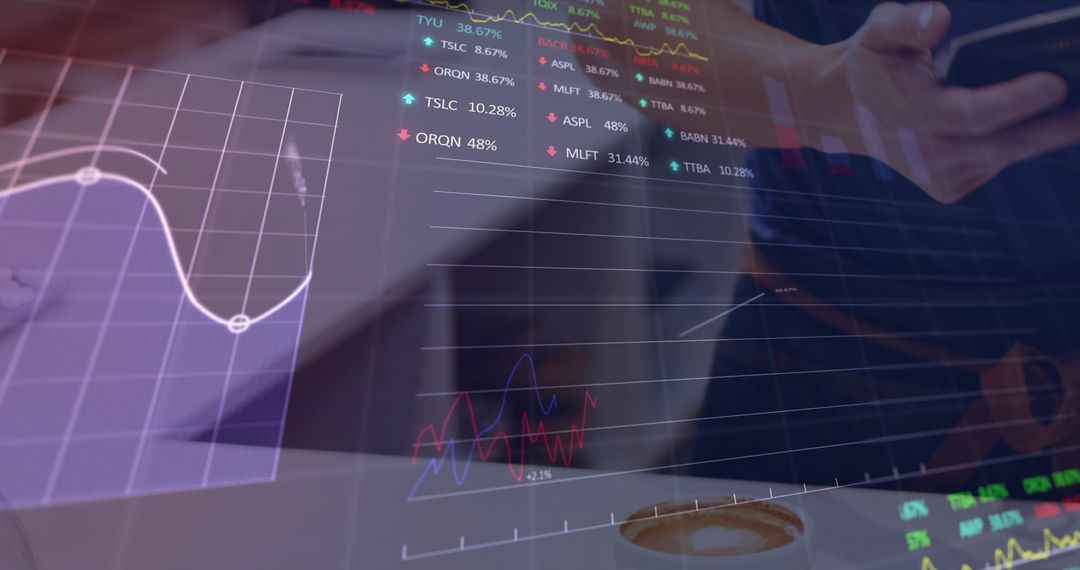
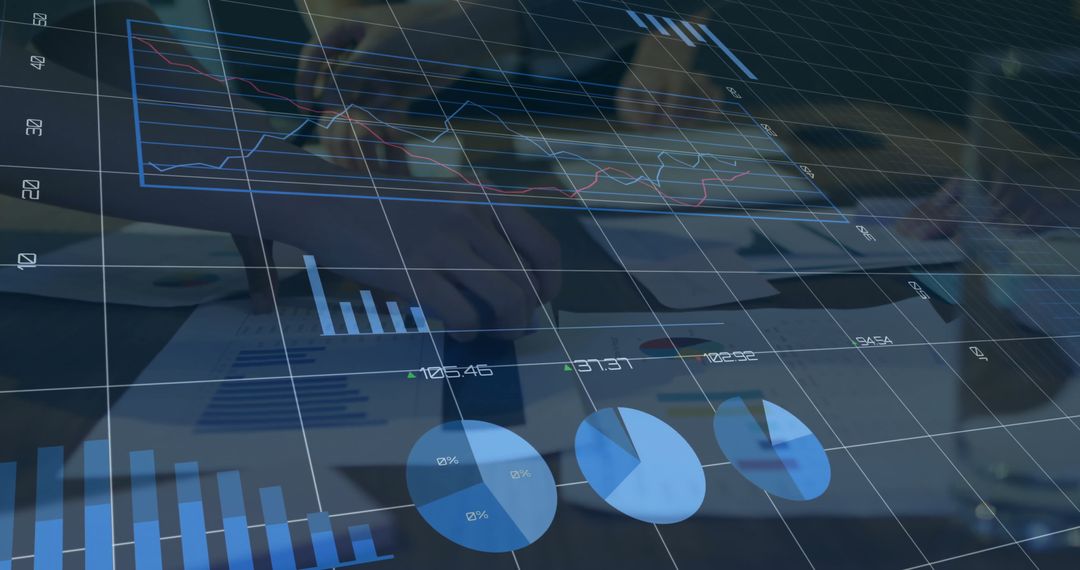
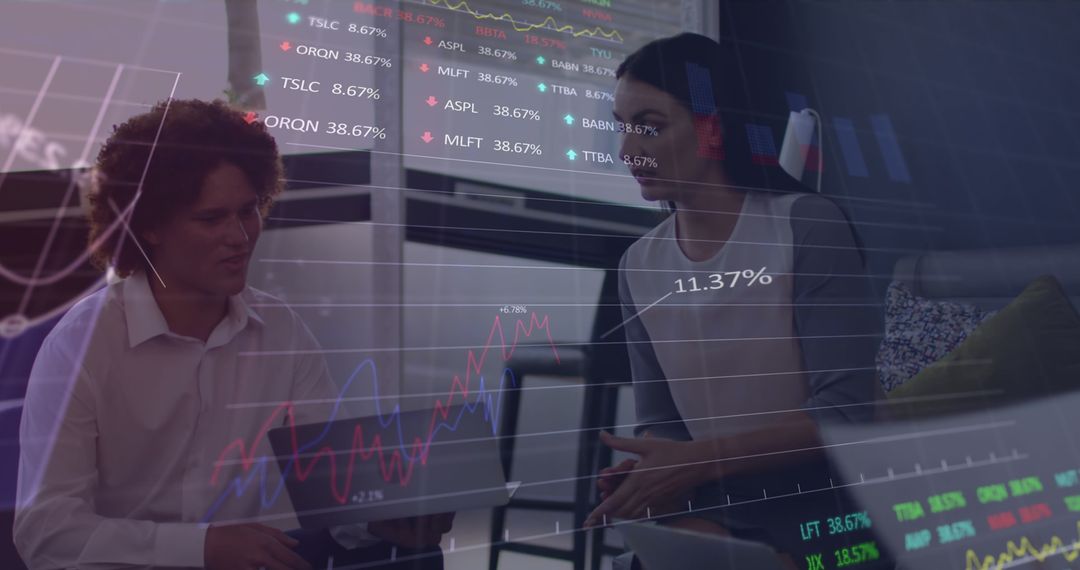
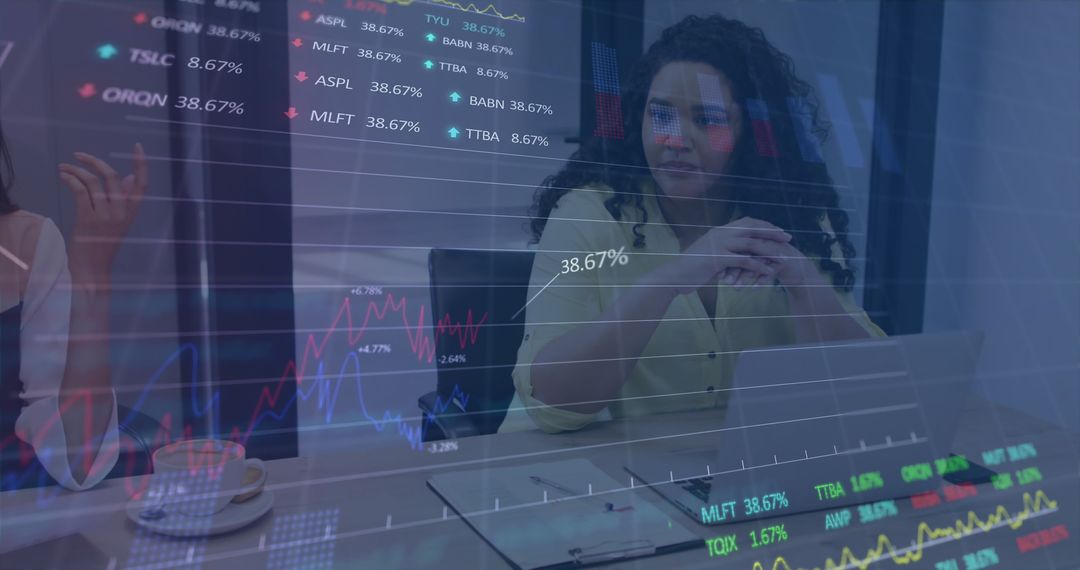
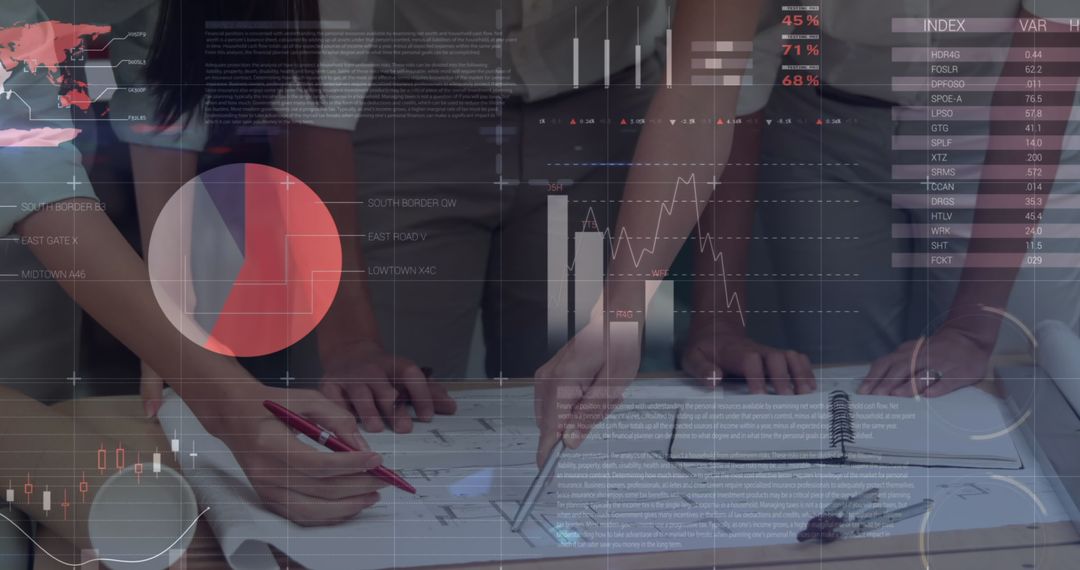
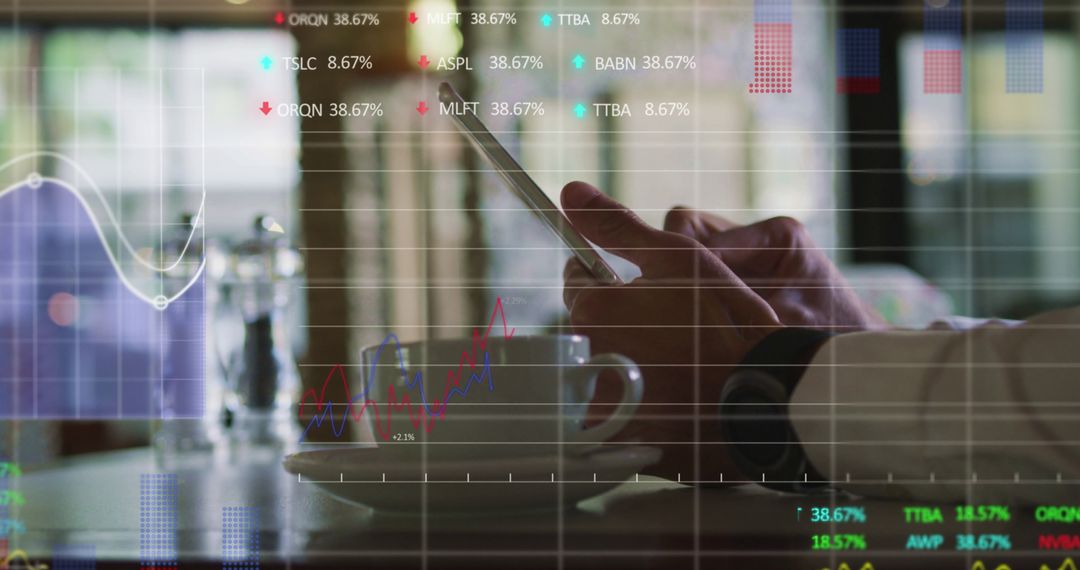
- People Analyzing Financial Data with Graph Overlays
People Analyzing Financial Data with Graph Overlays Image
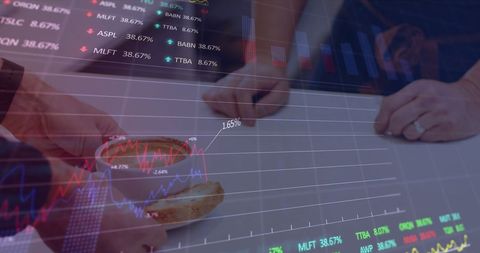
This depiction shows a meeting focusing on financial data analysis with graph overlays indicating dynamic financial trends. Diverse participants engage and utilize smartwatch payments — symbolizing integration of finance with technology. Ideal for illustrating topics in global market monitoring, business strategy discussions, or evolving tech-driven payment systems.
Powered by  - Get 15% off with code: PIKWIZARD15


2
downloads
downloads
Tags:
More
Credit Photo
If you would like to credit the Photo, here are some ways you can do so
Text Link
photo Link
<span class="text-link">
<span>
<a target="_blank" href=https://pikwizard.com/photo/people-analyzing-financial-data-with-graph-overlays/c0491465188fc171e9f9ad8b8720ada4/>PikWizard</a>
</span>
</span>
<span class="image-link">
<span
style="margin: 0 0 20px 0; display: inline-block; vertical-align: middle; width: 100%;"
>
<a
target="_blank"
href="https://pikwizard.com/photo/people-analyzing-financial-data-with-graph-overlays/c0491465188fc171e9f9ad8b8720ada4/"
style="text-decoration: none; font-size: 10px; margin: 0;"
>
<img src="https://pikwizard.com/pw/medium/c0491465188fc171e9f9ad8b8720ada4.jpg" style="margin: 0; width: 100%;" alt="" />
<p style="font-size: 12px; margin: 0;">PikWizard</p>
</a>
</span>
</span>
Free (free of charge)
Free for personal and commercial use.
Author: People Creations
Similar Free Stock Images

Premium


Premium


Premium


Premium


Premium


Premium


Premium


Premium


Premium


Premium


Premium


Premium


Premium


Premium


Premium


Premium


Premium


Premium


Premium


Premium


Premium


Premium


Premium


Premium