- Home >
- Stock Photos >
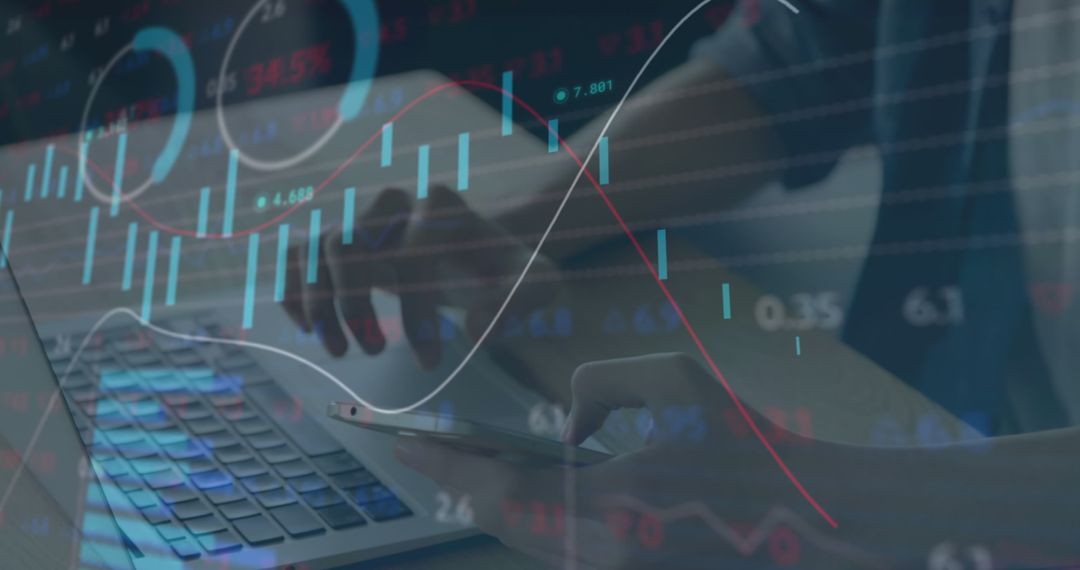
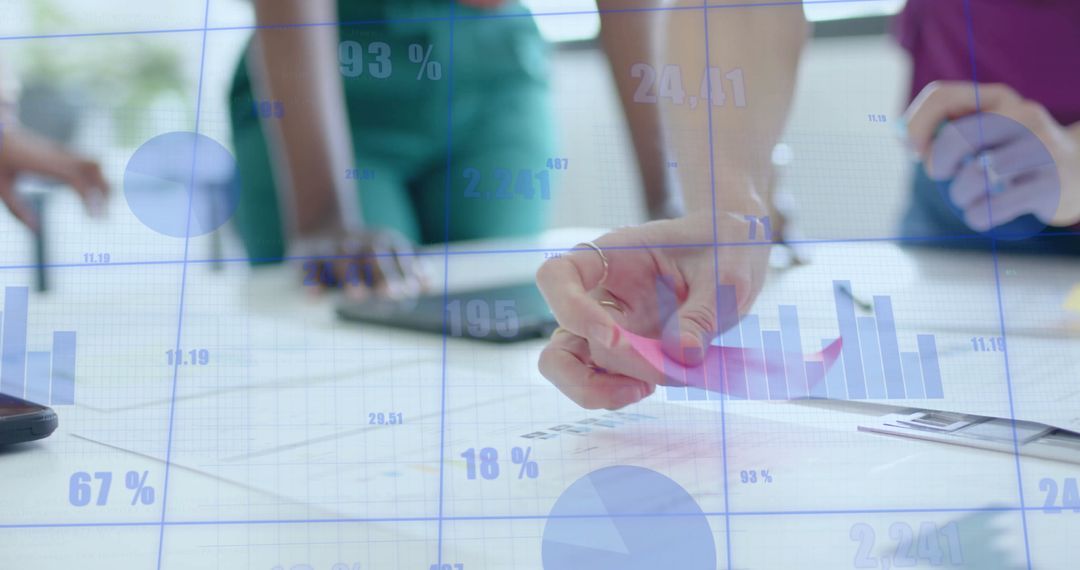
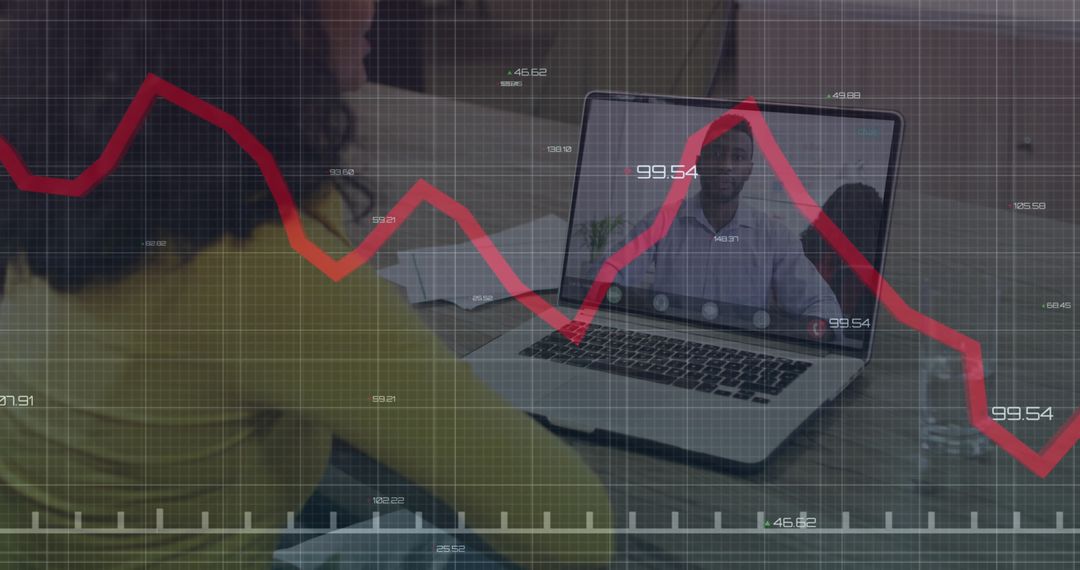
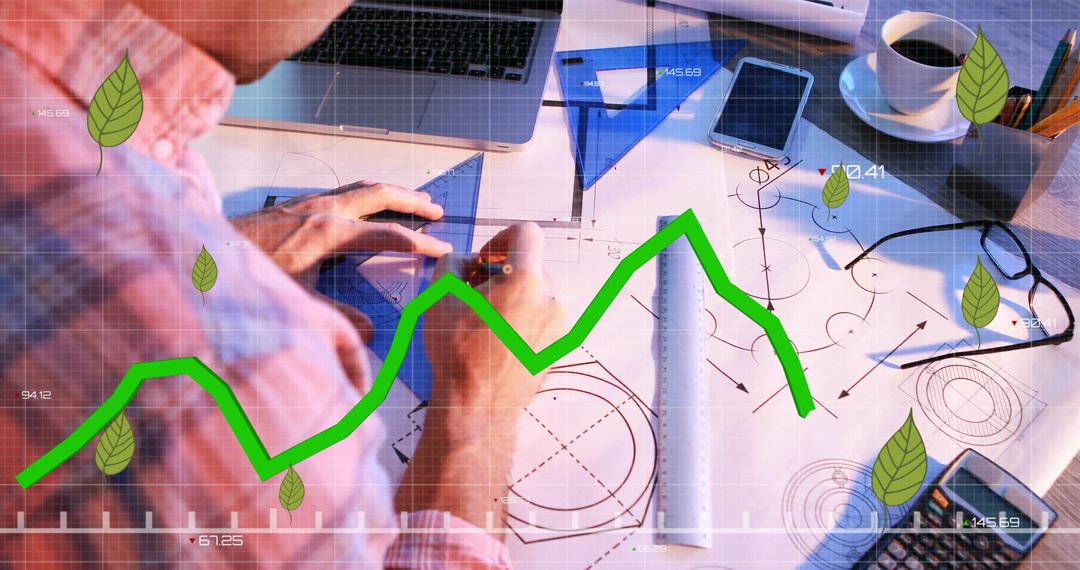
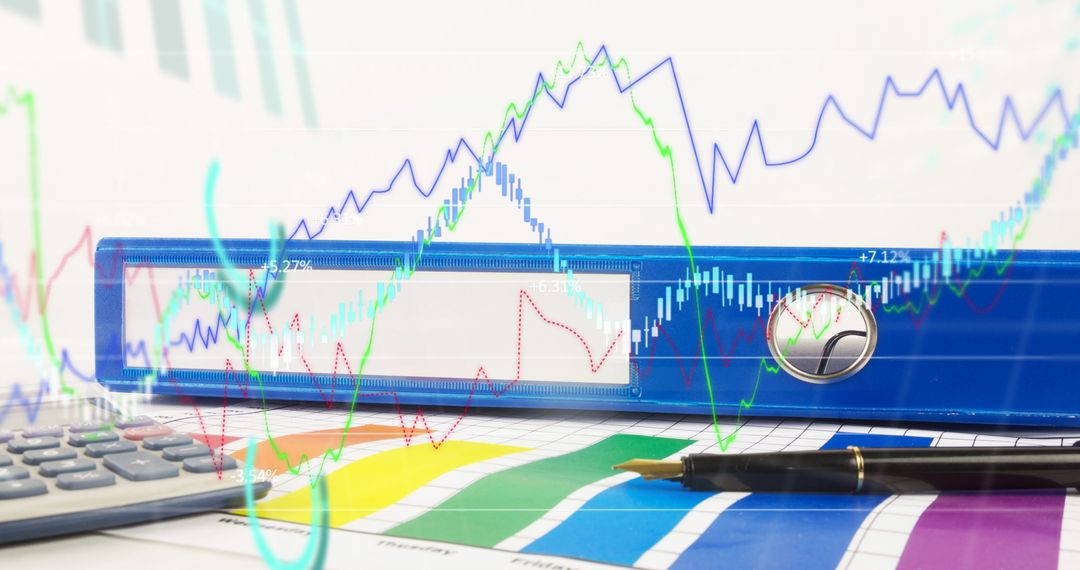
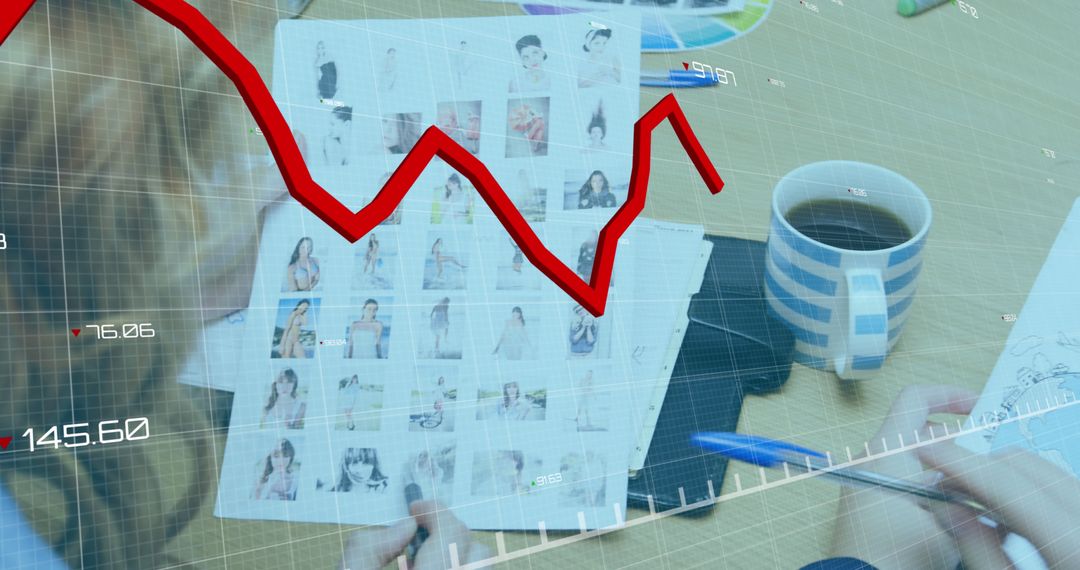
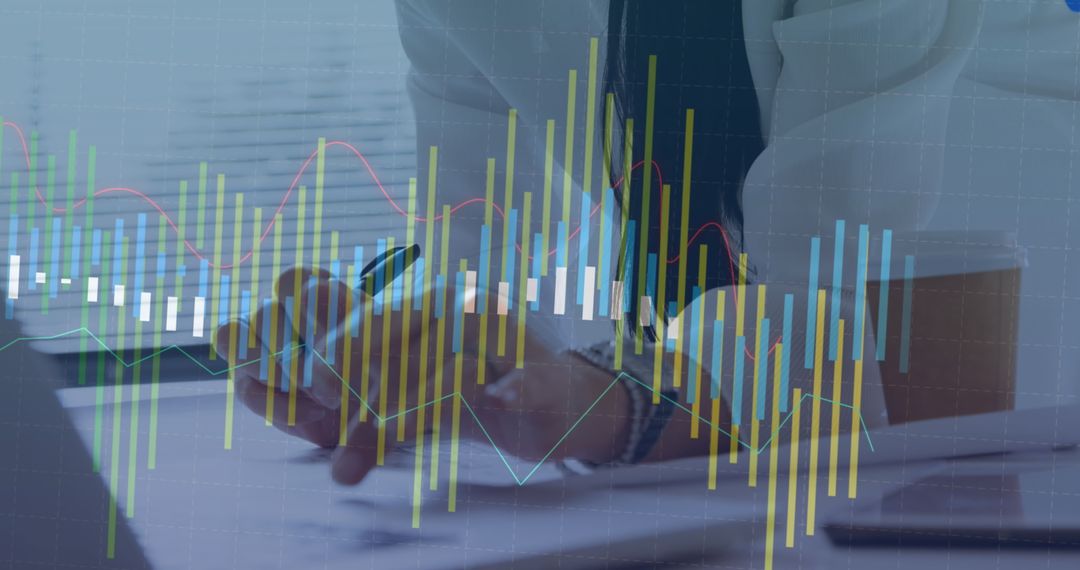
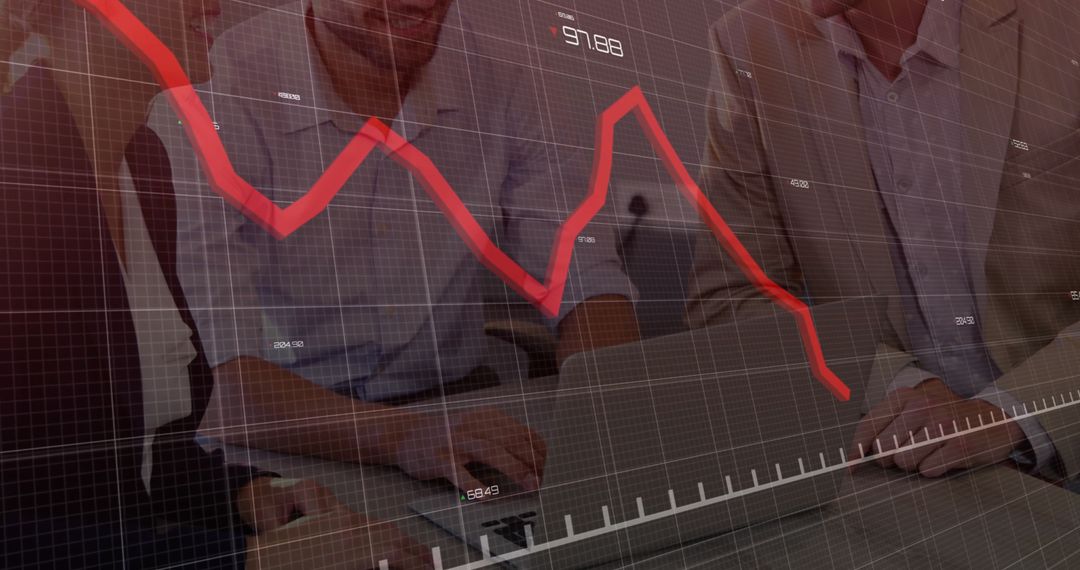
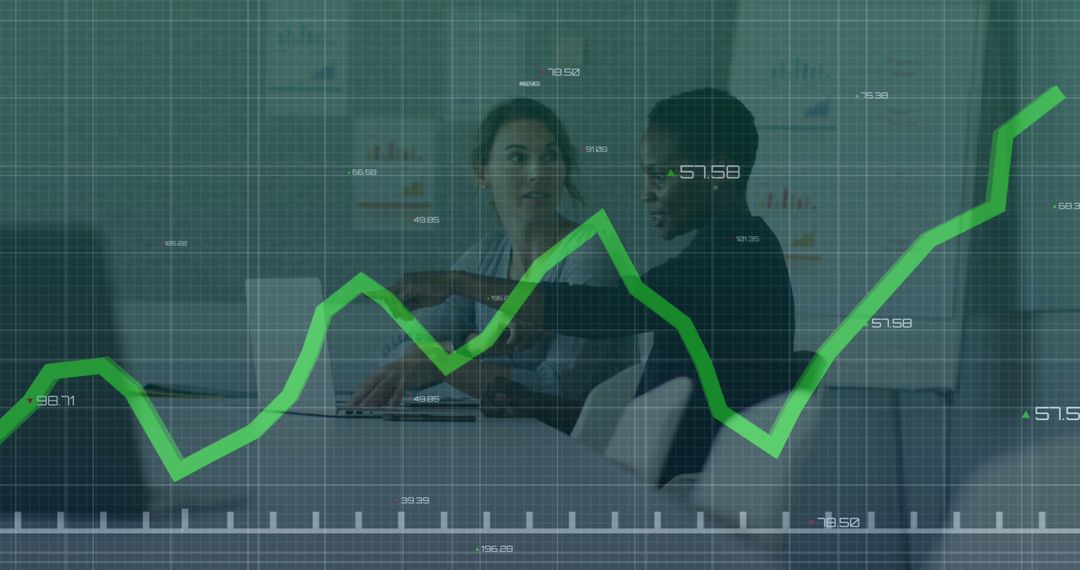
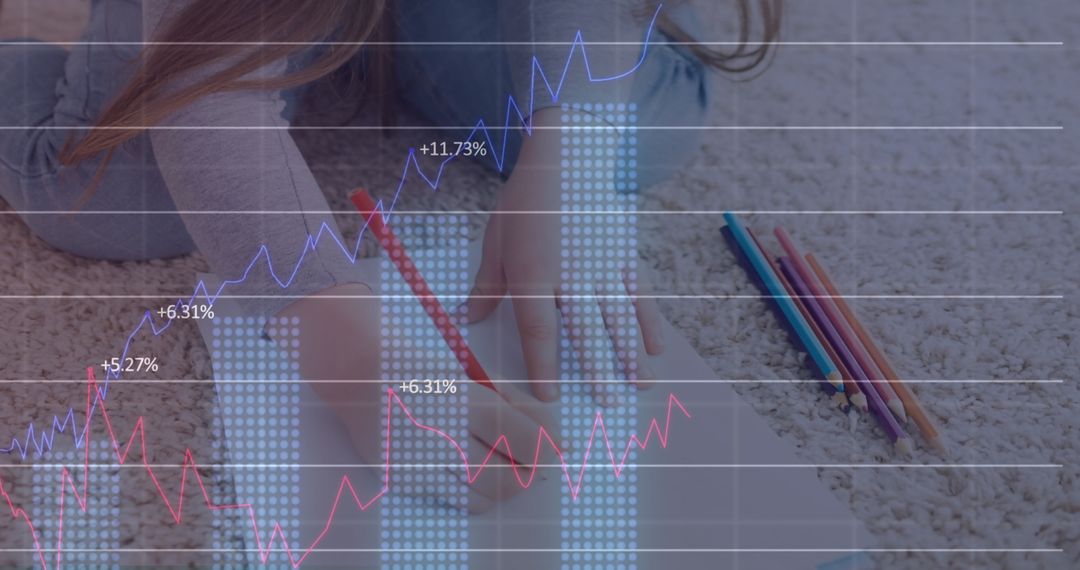
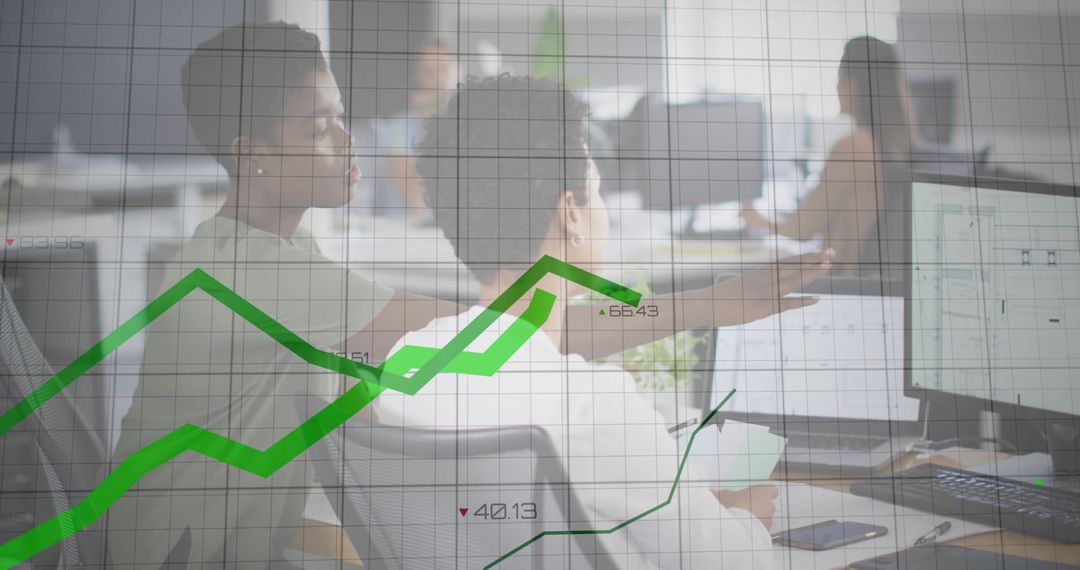
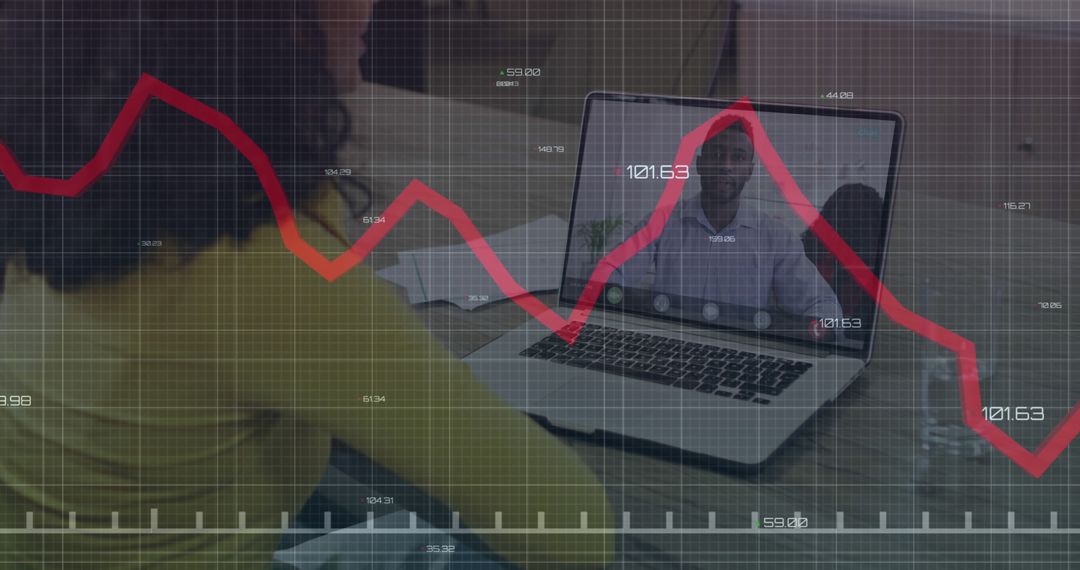
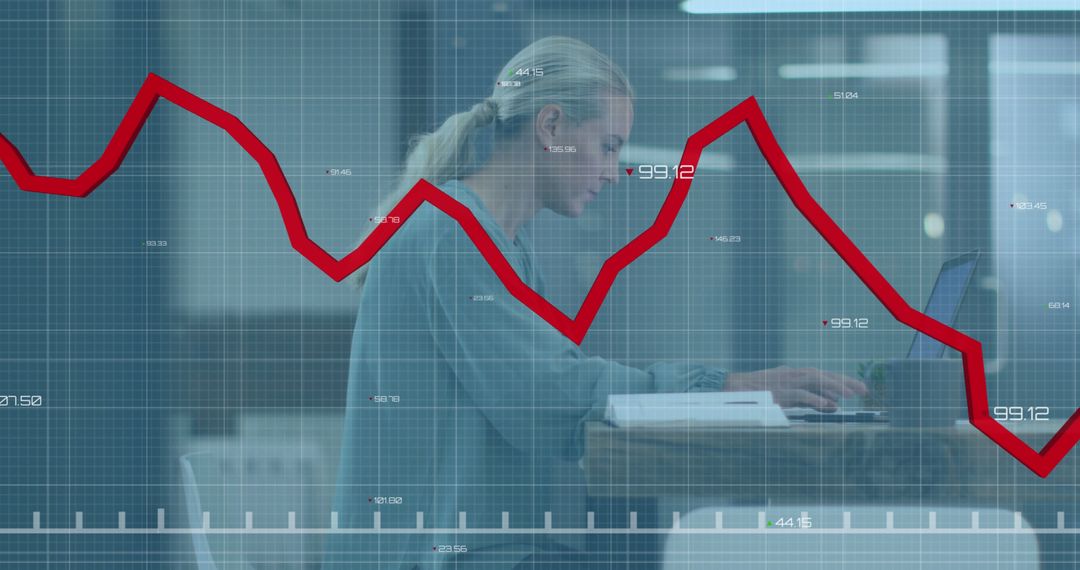
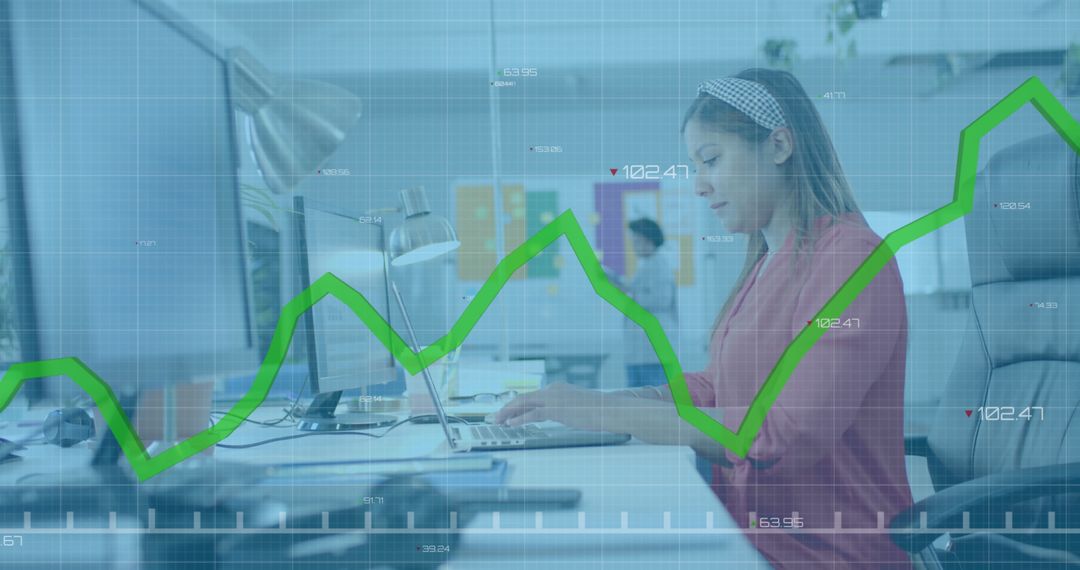
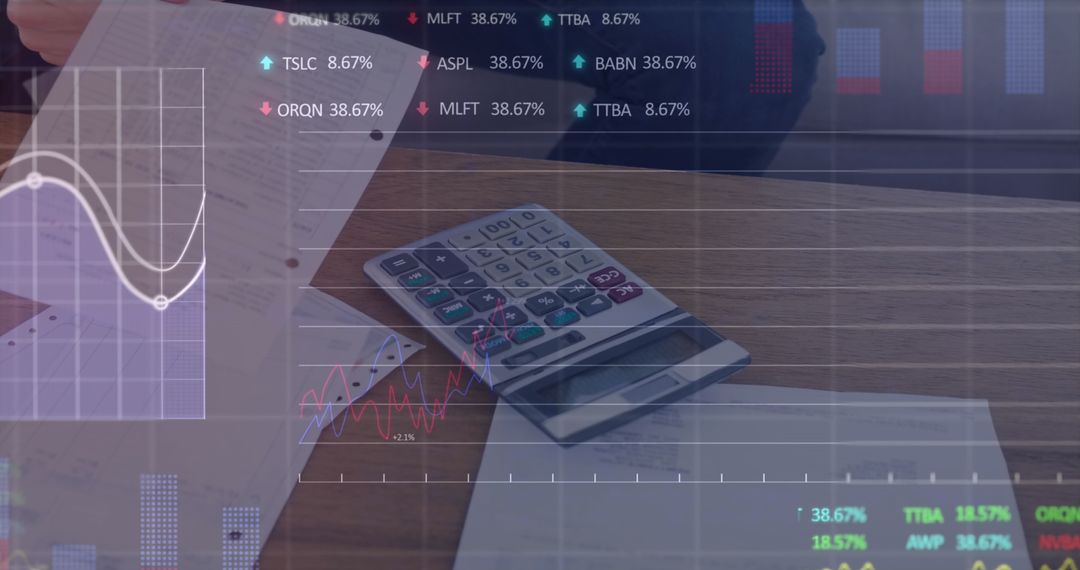
- Person Analyzing Financial Trends with Graphs and Calculations
Person Analyzing Financial Trends with Graphs and Calculations Image
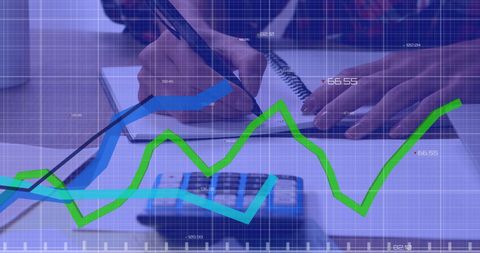
Depicts hands attentively analyzing financial data with superimposed graphs representing trends. Ideal for illustrating themes of financial reports, business analytics, data-driven decision making, or corporate presentations on data analysis.
Powered by 


2
downloads
downloads
Tags:
More
Credit Photo
If you would like to credit the Photo, here are some ways you can do so
Text Link
photo Link
<span class="text-link">
<span>
<a target="_blank" href=https://pikwizard.com/photo/person-analyzing-financial-trends-with-graphs-and-calculations/12f3d68ddf721e9da00ff0e6670befdb/>PikWizard</a>
</span>
</span>
<span class="image-link">
<span
style="margin: 0 0 20px 0; display: inline-block; vertical-align: middle; width: 100%;"
>
<a
target="_blank"
href="https://pikwizard.com/photo/person-analyzing-financial-trends-with-graphs-and-calculations/12f3d68ddf721e9da00ff0e6670befdb/"
style="text-decoration: none; font-size: 10px; margin: 0;"
>
<img src="https://pikwizard.com/pw/medium/12f3d68ddf721e9da00ff0e6670befdb.jpg" style="margin: 0; width: 100%;" alt="" />
<p style="font-size: 12px; margin: 0;">PikWizard</p>
</a>
</span>
</span>
Free (free of charge)
Free for personal and commercial use.
Author: Authentic Images
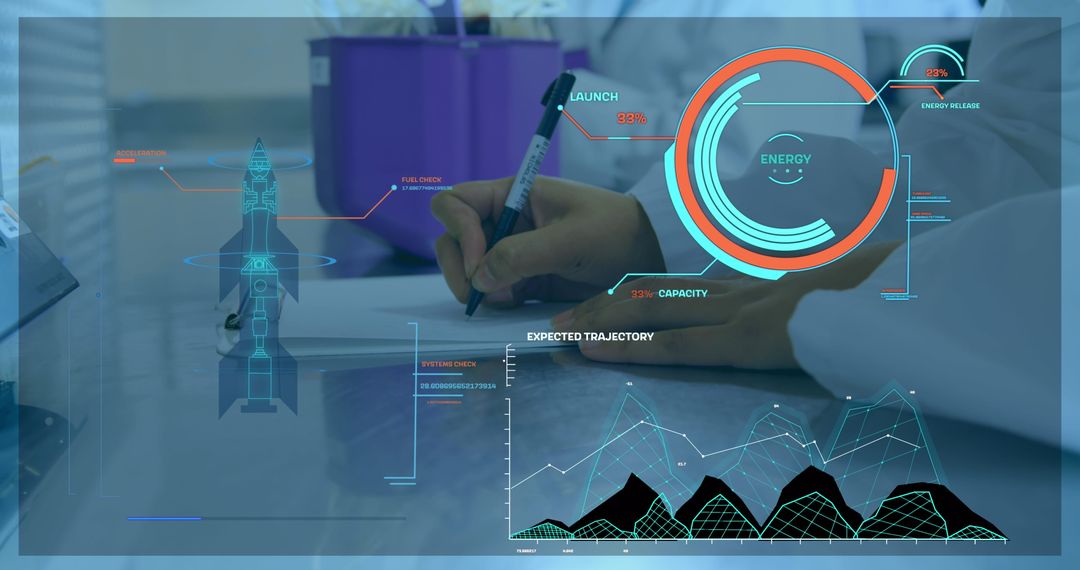
Similar Free Stock Images

Premium

Premium


Premium


Premium


Premium


Premium


Premium


Premium


Premium


Premium


Premium


Premium


Premium


Premium


Premium


Premium


Premium


Premium


Premium


Premium


Premium


Premium


Premium


Premium