
- Home >
- Stock Photos >
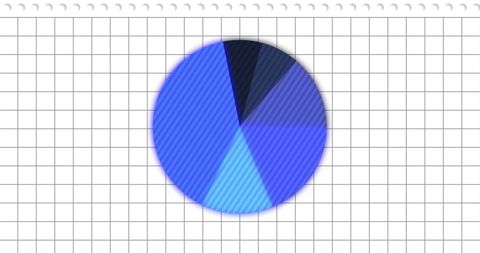
- Pie Chart on Blue Digital Interface Presenting Data Trends
Pie Chart on Blue Digital Interface Presenting Data Trends Image

A visually engaging depiction of a pie chart displayed on a blue digital interface, showcasing data analysis and technological concepts. Ideal for business presentations, educational materials, or websites related to data science, technology, and programming. The depiction of data processing and analyzing trends makes it suitable for illustrating reports and infographics.
Powered by 


downloads
Tags:
More
Credit Photo
If you would like to credit the Photo, here are some ways you can do so
Text Link
photo Link
<span class="text-link">
<span>
<a target="_blank" href=https://pikwizard.com/photo/pie-chart-on-blue-digital-interface-presenting-data-trends/e2b20651284ef8c1494ddc0095404936/>PikWizard</a>
</span>
</span>
<span class="image-link">
<span
style="margin: 0 0 20px 0; display: inline-block; vertical-align: middle; width: 100%;"
>
<a
target="_blank"
href="https://pikwizard.com/photo/pie-chart-on-blue-digital-interface-presenting-data-trends/e2b20651284ef8c1494ddc0095404936/"
style="text-decoration: none; font-size: 10px; margin: 0;"
>
<img src="https://pikwizard.com/pw/medium/e2b20651284ef8c1494ddc0095404936.jpg" style="margin: 0; width: 100%;" alt="" />
<p style="font-size: 12px; margin: 0;">PikWizard</p>
</a>
</span>
</span>
Free (free of charge)
Free for personal and commercial use.
Author: Authentic Images
Similar Free Stock Images
Premium


Premium


Premium


Premium


Premium


Premium


Premium

Premium


Premium


Premium


Premium


Premium

Premium

Premium

Premium


Premium

Premium


Premium


Premium


Premium

Premium


Premium

Premium


Premium


Premium


Explore More Free Stock Images