- Home >
- Stock Photos >
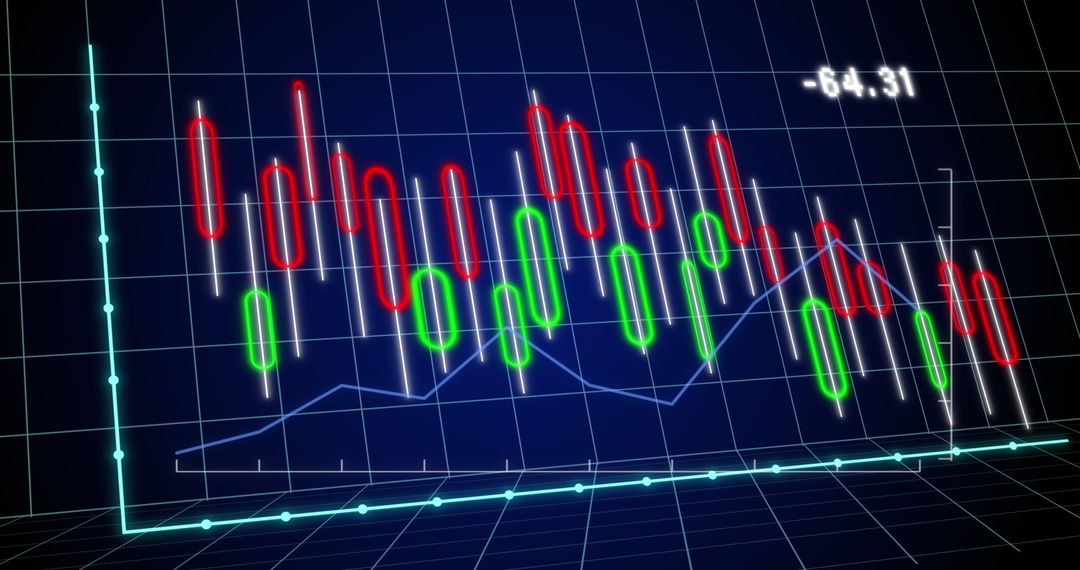
- Pink Graph and Data Analysis on 3D Grid for Financial Trends
Pink Graph and Data Analysis on 3D Grid for Financial Trends Image

Dynamic pink graph and digital data overlay on a 3D grid symbolize data processing and financial trends. Ideal for business sites or articles focused on market analysis, technology, economic forecasting, or data-driven decision making. Visual modern style suits tech-focused content.
Powered by 


2
downloads
downloads
Tags:
More
Credit Photo
If you would like to credit the Photo, here are some ways you can do so
Text Link
photo Link
<span class="text-link">
<span>
<a target="_blank" href=https://pikwizard.com/photo/pink-graph-and-data-analysis-on-3d-grid-for-financial-trends/fc12bf15042e29bc0a71d9f69e303d97/>PikWizard</a>
</span>
</span>
<span class="image-link">
<span
style="margin: 0 0 20px 0; display: inline-block; vertical-align: middle; width: 100%;"
>
<a
target="_blank"
href="https://pikwizard.com/photo/pink-graph-and-data-analysis-on-3d-grid-for-financial-trends/fc12bf15042e29bc0a71d9f69e303d97/"
style="text-decoration: none; font-size: 10px; margin: 0;"
>
<img src="https://pikwizard.com/pw/medium/fc12bf15042e29bc0a71d9f69e303d97.jpg" style="margin: 0; width: 100%;" alt="" />
<p style="font-size: 12px; margin: 0;">PikWizard</p>
</a>
</span>
</span>
Free (free of charge)
Free for personal and commercial use.
Author: Authentic Images
Similar Free Stock Images

Premium


Premium


Premium


Premium


Premium


Premium


Premium


Premium


Premium


Premium


Premium


Premium


Premium


Premium


Premium


Premium


Premium


Premium


Premium


Premium


Premium


Premium


Premium


Premium