- Home >
- Stock Photos >
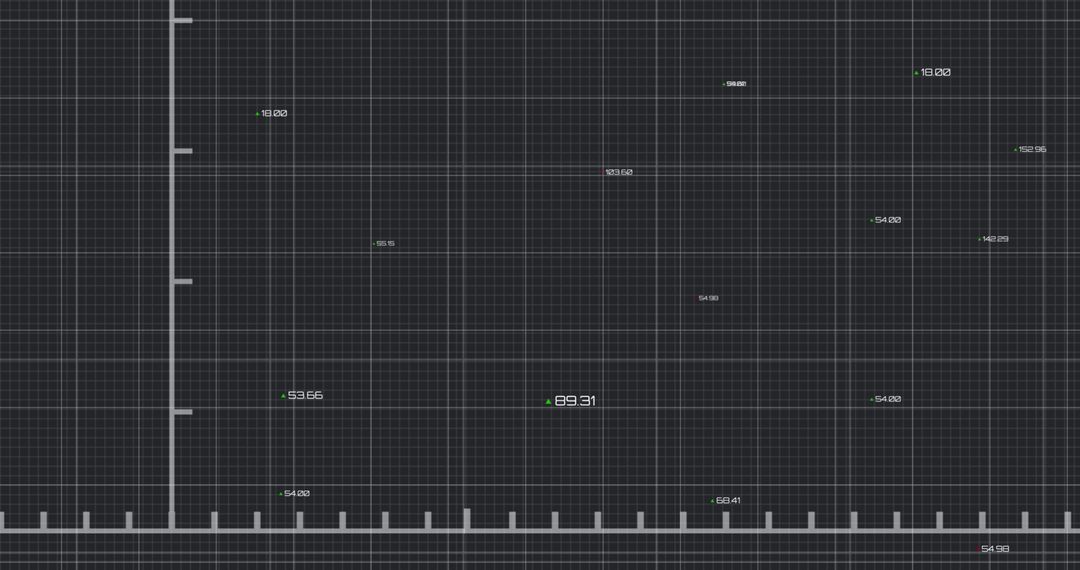
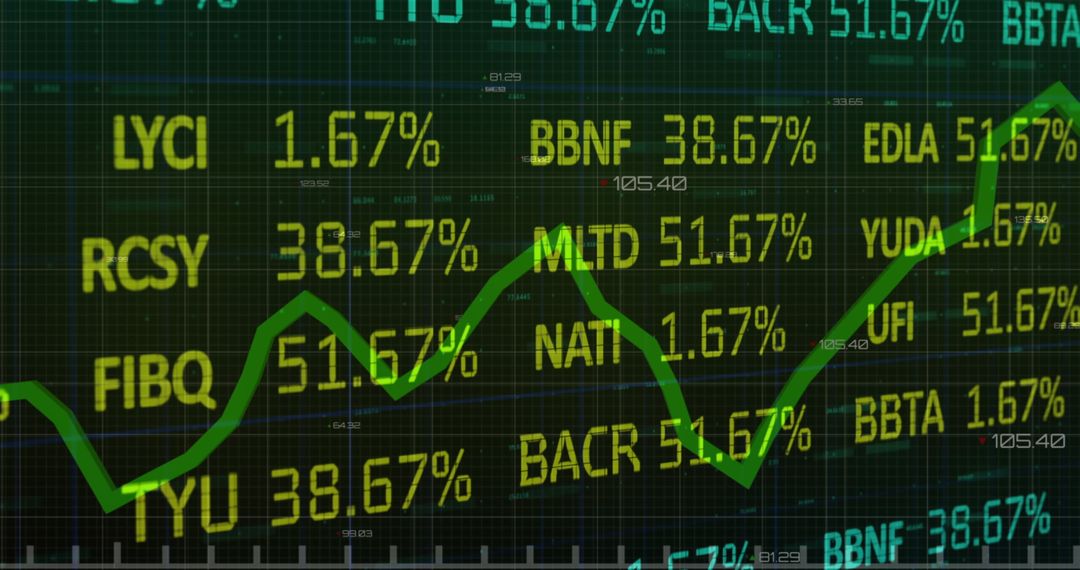
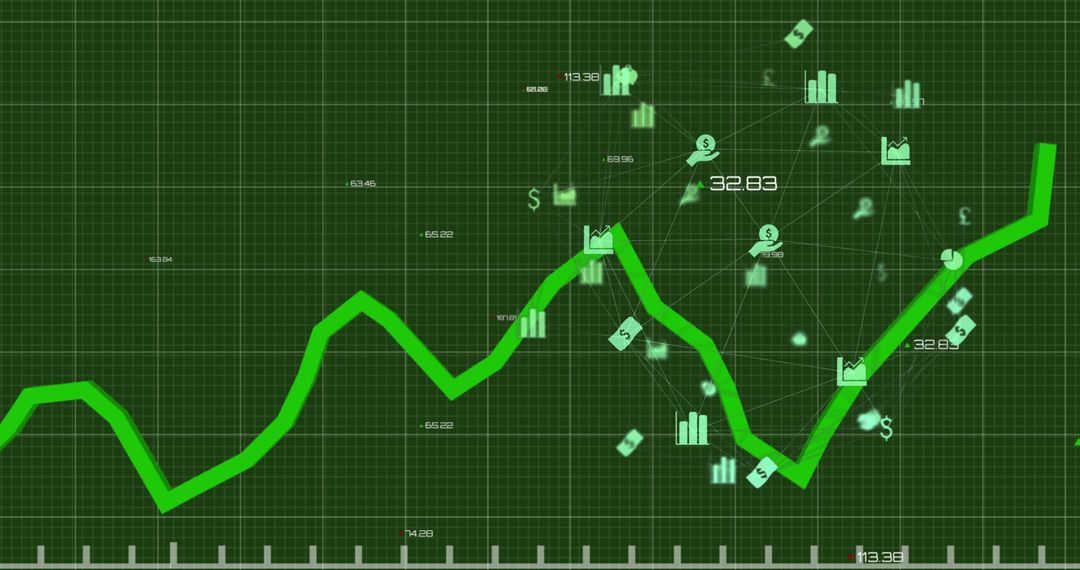
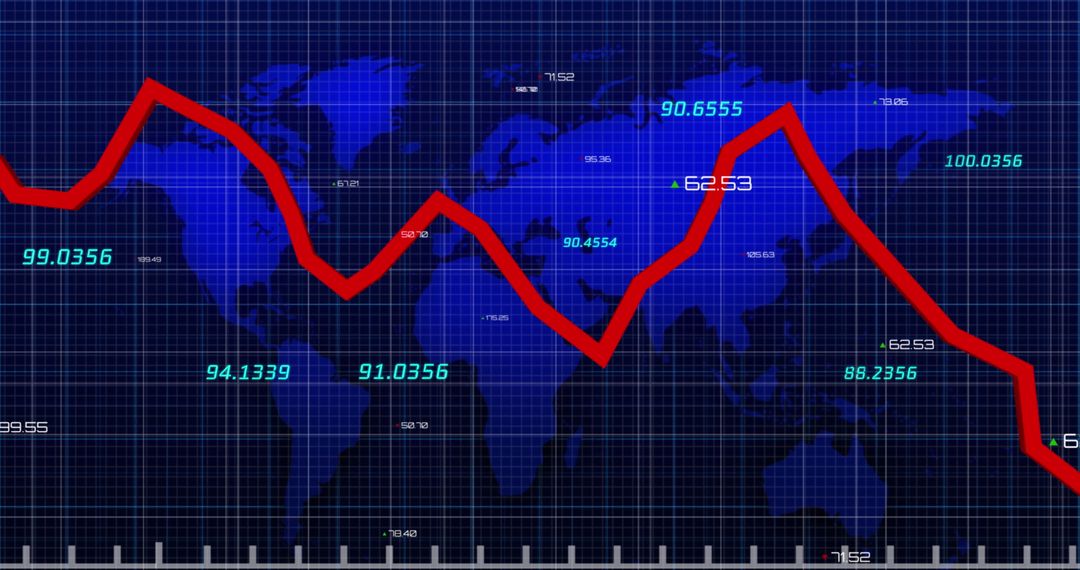
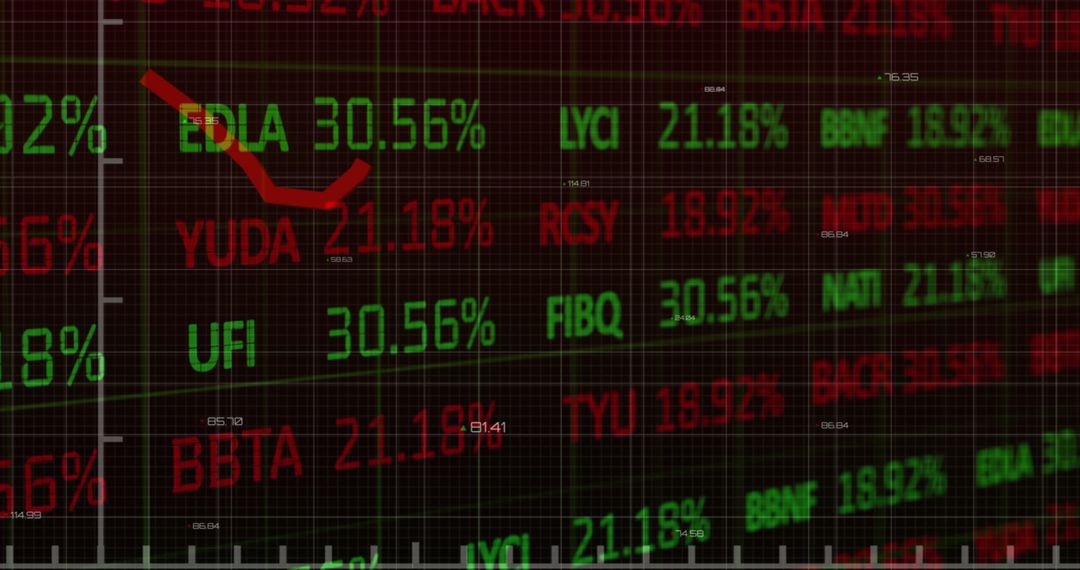
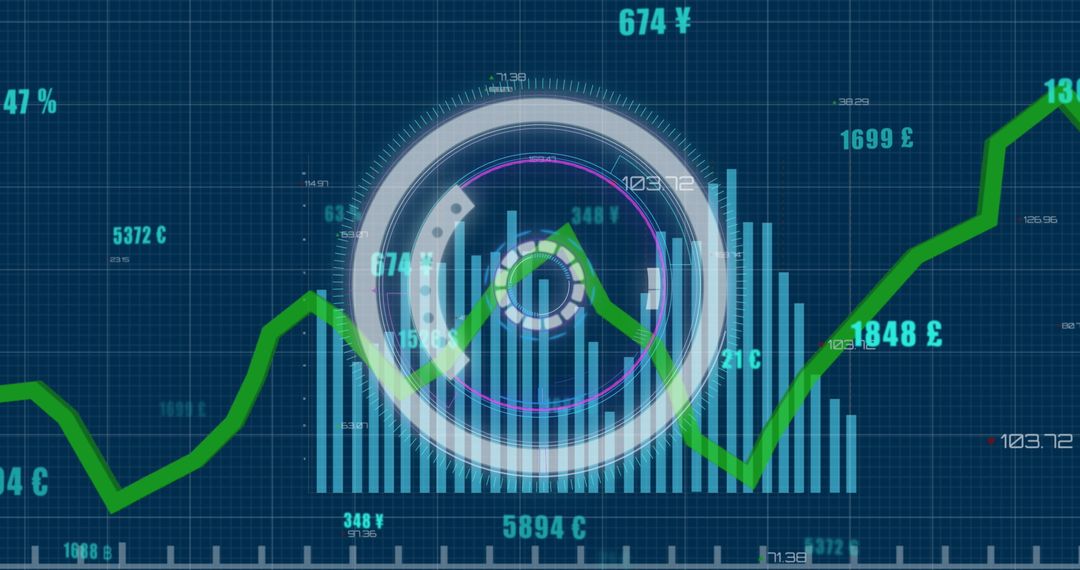
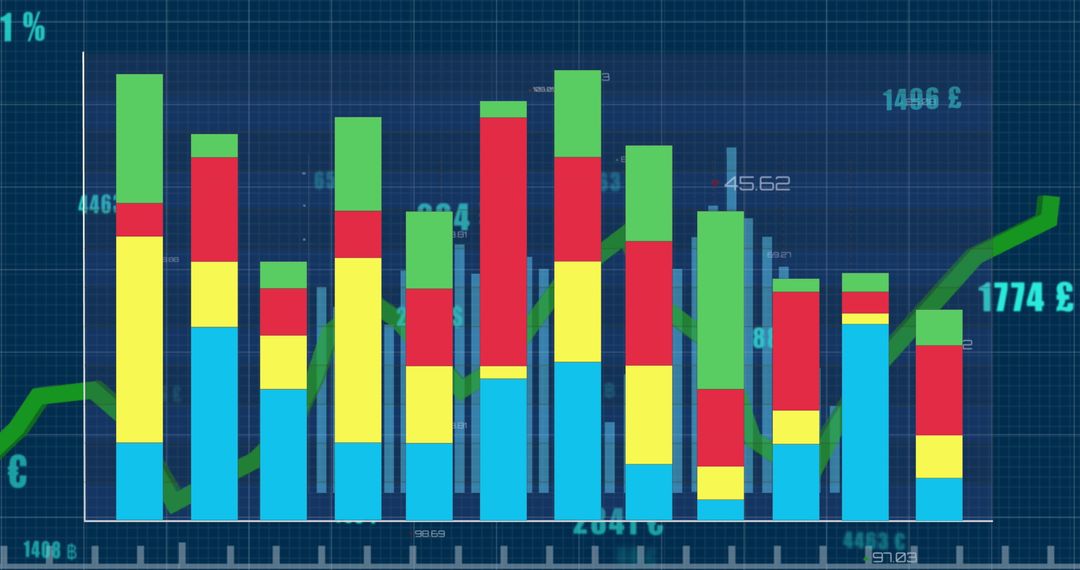
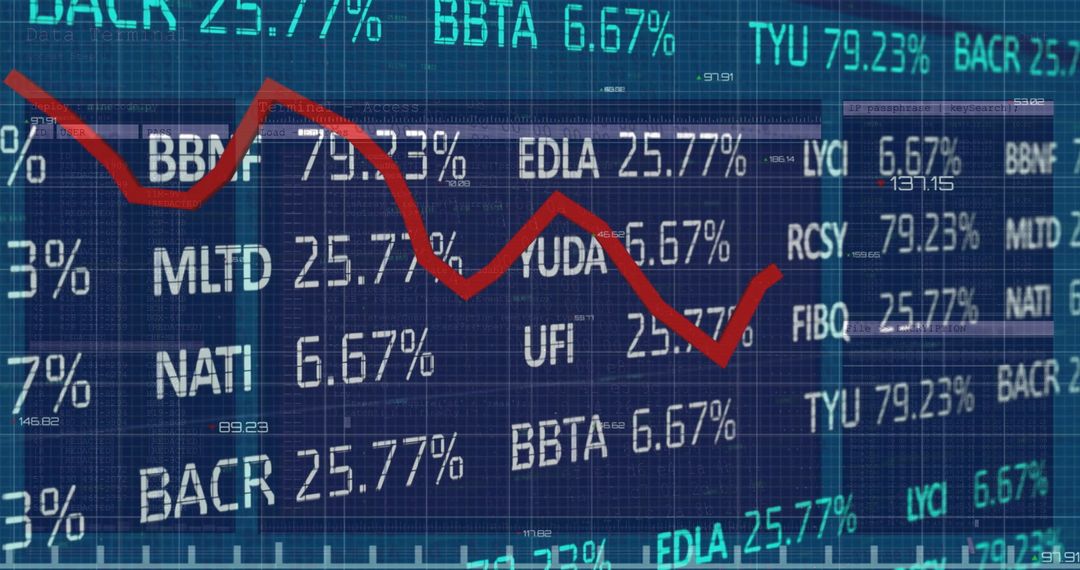
- Pizza Business Analytics Infographic with Trend Graph
Pizza Business Analytics Infographic with Trend Graph Image

Steeped in dynamic data analysis, this depiction illustrates sales or business trends in the pizza industry. The graph showcases fluctuating trends with overlaying bold typography 'PIZZA.' Suitable for presentations, corporate reports, or marketing materials curated to grasp viewers' attention on related business statistics.

2
downloads
downloads
Tags:
More
Credit Photo
If you would like to credit the Photo, here are some ways you can do so
Text Link
photo Link
<span class="text-link">
<span>
<a target="_blank" href=https://pikwizard.com/photo/pizza-business-analytics-infographic-with-trend-graph/1005193270dee36113763217fa09f890/>PikWizard</a>
</span>
</span>
<span class="image-link">
<span
style="margin: 0 0 20px 0; display: inline-block; vertical-align: middle; width: 100%;"
>
<a
target="_blank"
href="https://pikwizard.com/photo/pizza-business-analytics-infographic-with-trend-graph/1005193270dee36113763217fa09f890/"
style="text-decoration: none; font-size: 10px; margin: 0;"
>
<img src="https://pikwizard.com/pw/medium/1005193270dee36113763217fa09f890.jpg" style="margin: 0; width: 100%;" alt="" />
<p style="font-size: 12px; margin: 0;">PikWizard</p>
</a>
</span>
</span>
Free (free of charge)
Free for personal and commercial use.
Author: Awesome Content
Similar Free Stock Images