- Home >
- Stock Photos >
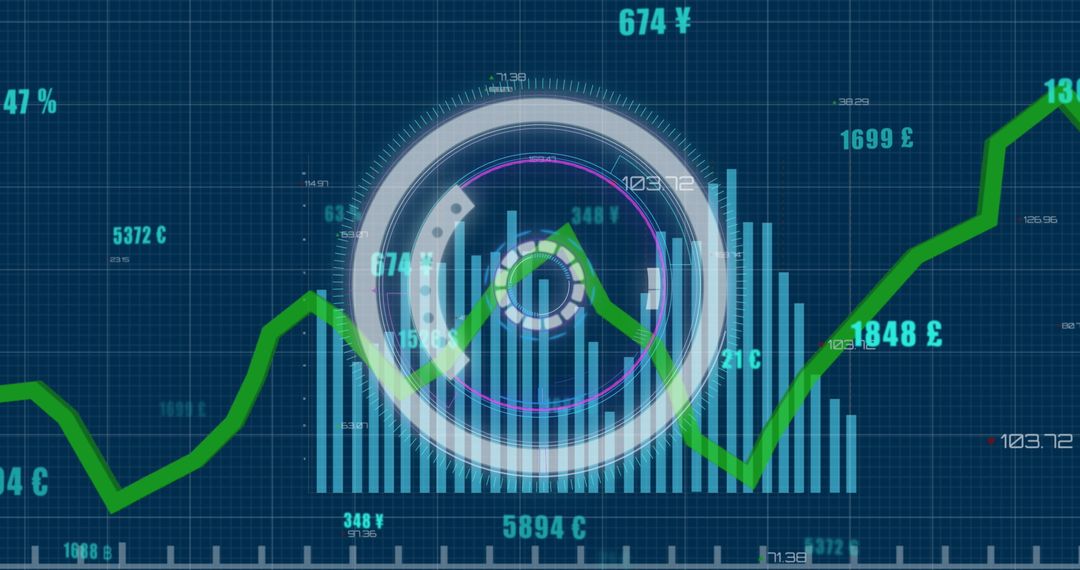
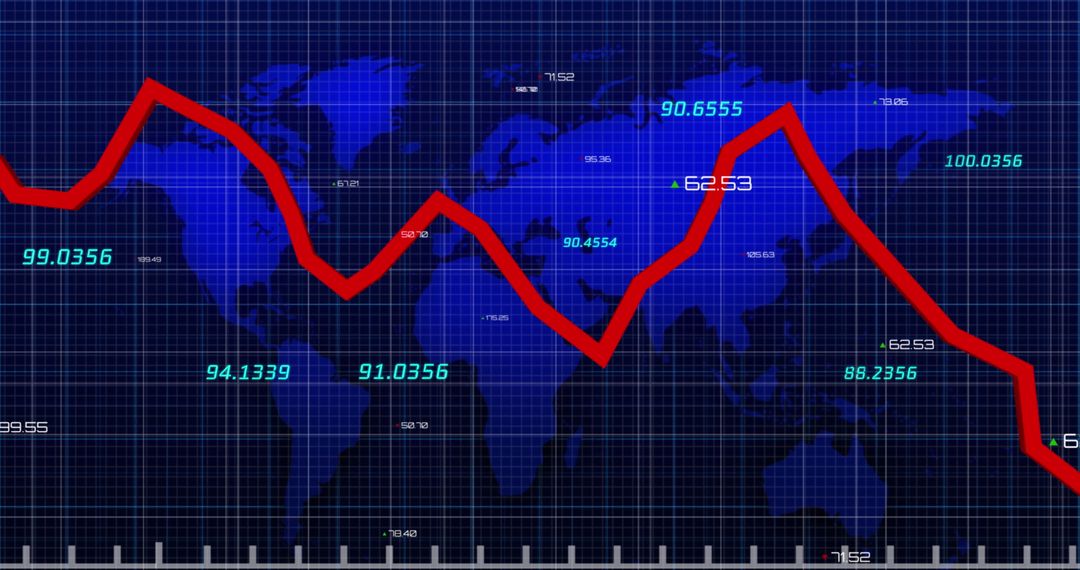
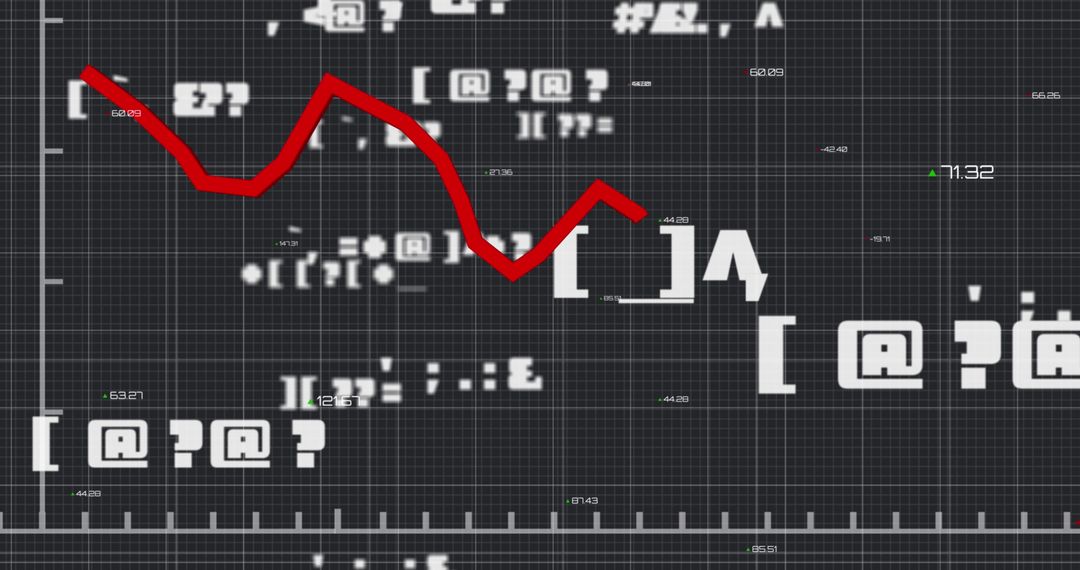
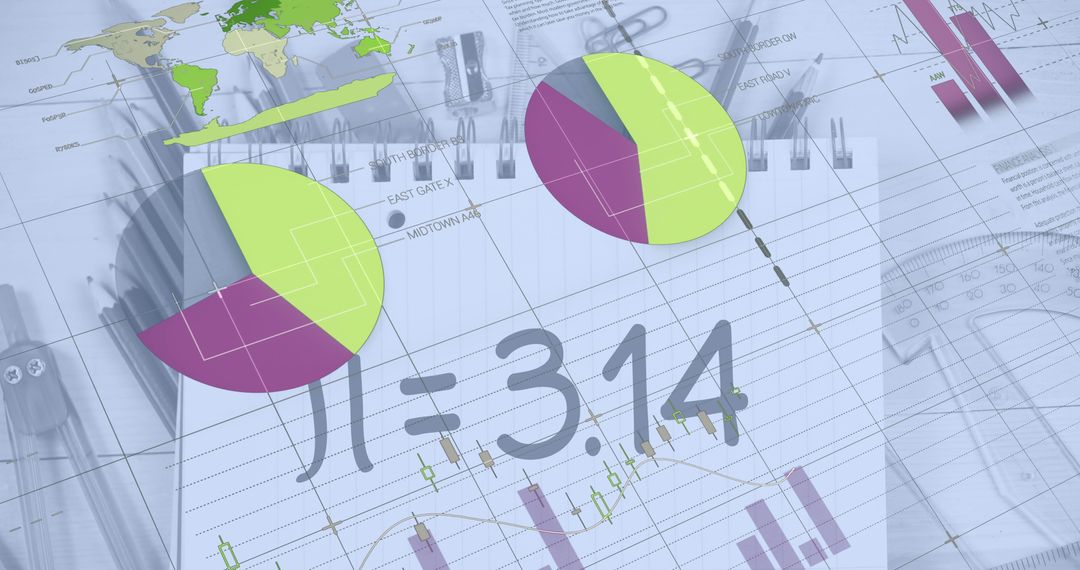
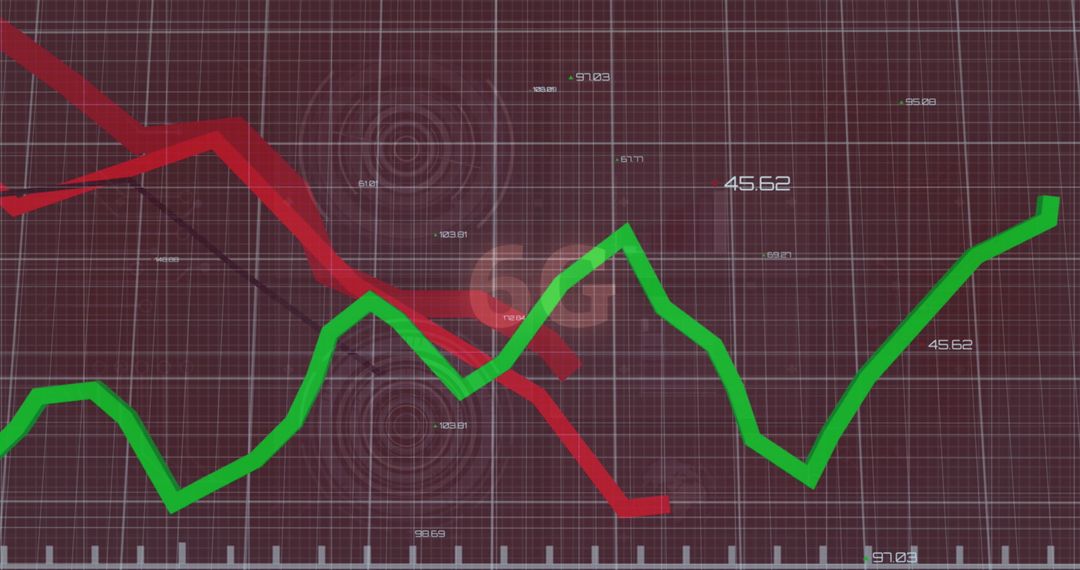
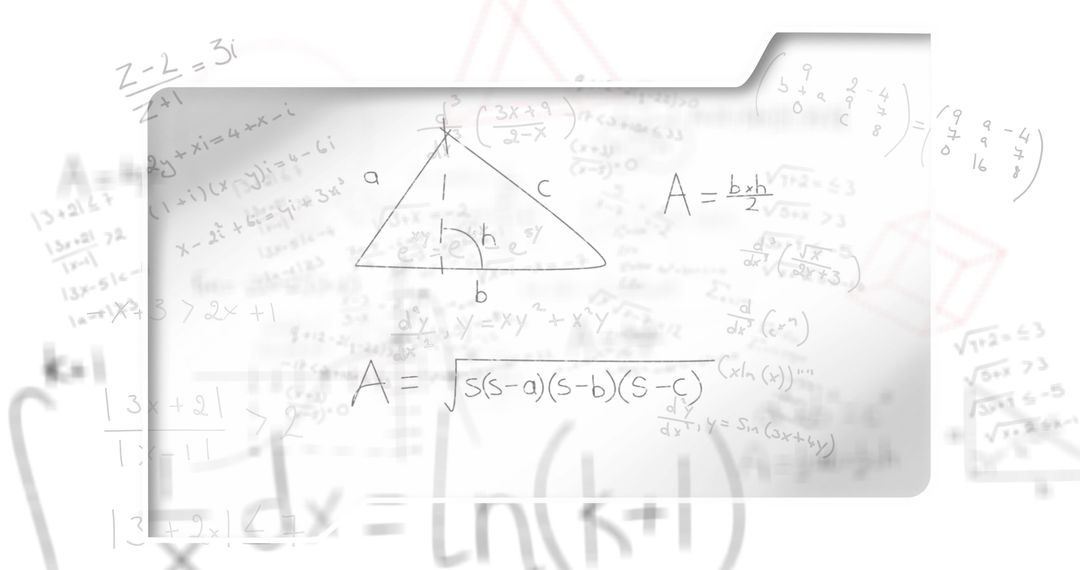
- Plummeting Financial Graph with Mathematics Symbolic Elements
Plummeting Financial Graph with Mathematics Symbolic Elements Image
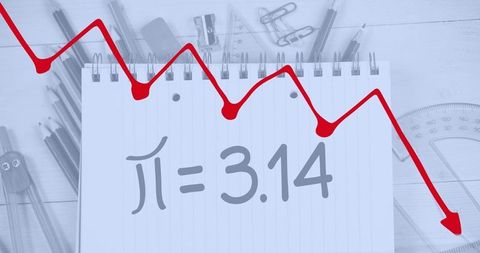
Conceptual illustration combines financial canary graph indicating downturn with pi formula, integrating elements of mathematics and finance. Useful for educational pieces on economic studies, articles analyzing financial downturns, lessons on merging mathematics with practical finance education, and illustration of stock market or economic challenges.
Powered by 


2
downloads
downloads
Tags:
More
Credit Photo
If you would like to credit the Photo, here are some ways you can do so
Text Link
photo Link
<span class="text-link">
<span>
<a target="_blank" href=https://pikwizard.com/photo/plummeting-financial-graph-with-mathematics-symbolic-elements/0226fb3b122bd2fd6ca35ac55ff049aa/>PikWizard</a>
</span>
</span>
<span class="image-link">
<span
style="margin: 0 0 20px 0; display: inline-block; vertical-align: middle; width: 100%;"
>
<a
target="_blank"
href="https://pikwizard.com/photo/plummeting-financial-graph-with-mathematics-symbolic-elements/0226fb3b122bd2fd6ca35ac55ff049aa/"
style="text-decoration: none; font-size: 10px; margin: 0;"
>
<img src="https://pikwizard.com/pw/medium/0226fb3b122bd2fd6ca35ac55ff049aa.jpg" style="margin: 0; width: 100%;" alt="" />
<p style="font-size: 12px; margin: 0;">PikWizard</p>
</a>
</span>
</span>
Free (free of charge)
Free for personal and commercial use.
Author: Creative Art
Similar Free Stock Images

Premium


Premium


Premium


Premium


Premium


Premium


Premium


Premium


Premium


Premium


Premium


Premium


Premium


Premium


Premium


Premium


Premium


Premium


Premium


Premium


Premium


Premium


Premium


Premium