- Home >
- Stock Photos >
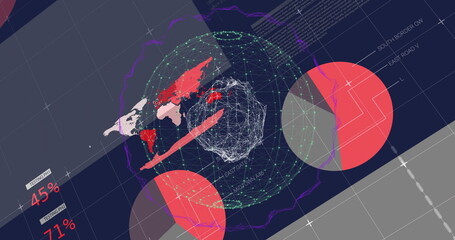
- polygonal globe virtual dashboard digital analytics metric visualization
polygonal globe virtual dashboard digital analytics metric visualization Image

This depicts a technological representation of a polygonal globe with overlaying metric bubbles, connectivity arcs, and grid lines. This futuristic concept showcases global data analytics and digital networks, used to visualize metrics within modern technological frameworks. It is suitable for use in presentations and publications related to technology innovations, global data, social media, and network analysis.
Powered by 


downloads
Tags:
More
Credit Photo
If you would like to credit the Photo, here are some ways you can do so
Text Link
photo Link
<span class="text-link">
<span>
<a target="_blank" href=https://pikwizard.com/photo/polygonal-globe-virtual-dashboard-digital-analytics-metric-visualization/5b4a894410f1792e97b4c370eb61eb0e/>PikWizard</a>
</span>
</span>
<span class="image-link">
<span
style="margin: 0 0 20px 0; display: inline-block; vertical-align: middle; width: 100%;"
>
<a
target="_blank"
href="https://pikwizard.com/photo/polygonal-globe-virtual-dashboard-digital-analytics-metric-visualization/5b4a894410f1792e97b4c370eb61eb0e/"
style="text-decoration: none; font-size: 10px; margin: 0;"
>
<img src="https://pikwizard.com/pw/medium/5b4a894410f1792e97b4c370eb61eb0e.jpg" style="margin: 0; width: 100%;" alt="" />
<p style="font-size: 12px; margin: 0;">PikWizard</p>
</a>
</span>
</span>
Free (free of charge)
Free for personal and commercial use.
Author: Awesome Content