
- Home >
- Stock Photos >
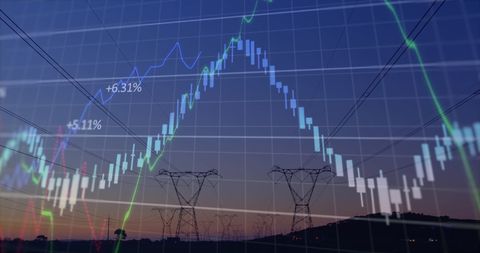
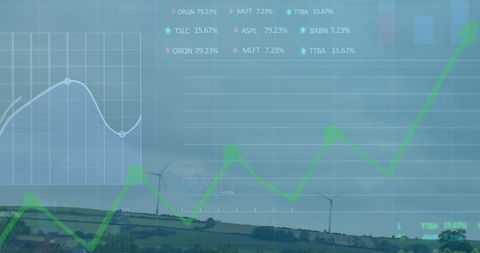
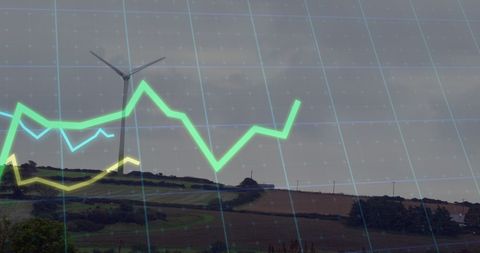
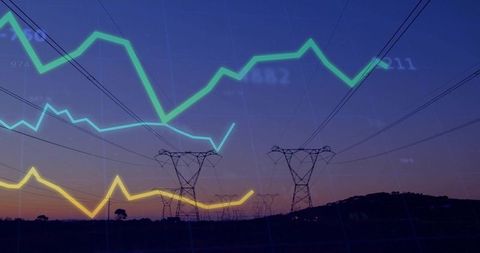
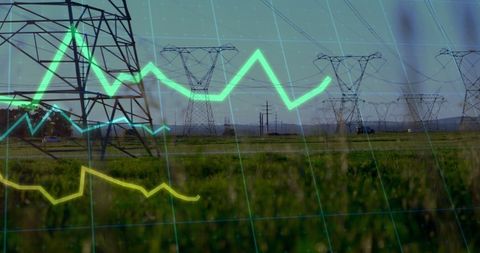
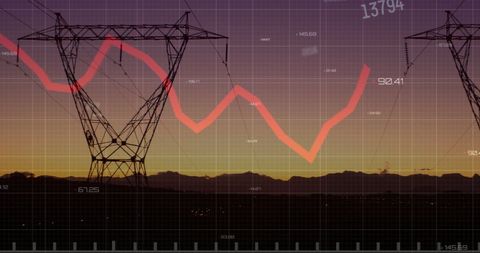
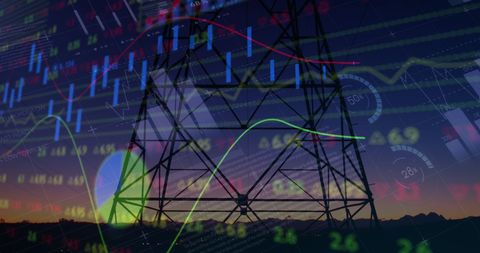
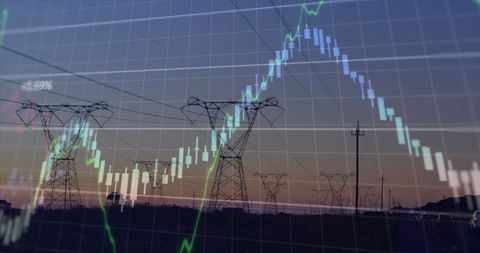
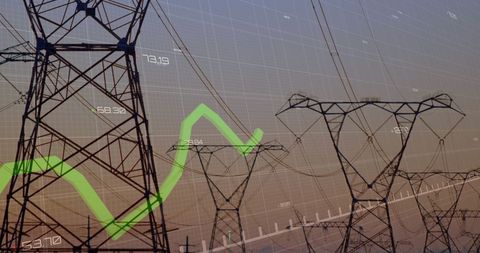
- Power Grid Analytics with Green Trend Line
Power Grid Analytics with Green Trend Line Image
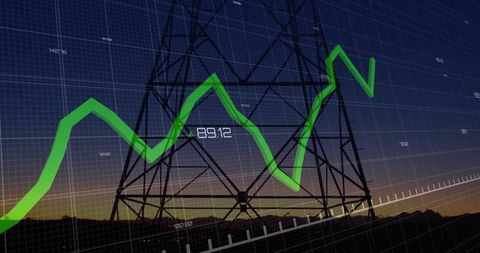
This digital illustration overlays a significant statistical trend line over a power grid structure at dusk. The scene symbolizes energy analytics, technological representation, and infrastructure forecasting. Ideal for use in energy sector presentations, strategic planning reports, analysis of industry trends, or educational materials emphasizing the integration of data with infrastructure.
Powered by 


downloads
Tags:
More
Credit Photo
If you would like to credit the Photo, here are some ways you can do so
Text Link
photo Link
<span class="text-link">
<span>
<a target="_blank" href=https://pikwizard.com/photo/power-grid-analytics-with-green-trend-line/159fe11dfd694e4852783a85b0d2d4e6/>PikWizard</a>
</span>
</span>
<span class="image-link">
<span
style="margin: 0 0 20px 0; display: inline-block; vertical-align: middle; width: 100%;"
>
<a
target="_blank"
href="https://pikwizard.com/photo/power-grid-analytics-with-green-trend-line/159fe11dfd694e4852783a85b0d2d4e6/"
style="text-decoration: none; font-size: 10px; margin: 0;"
>
<img src="https://pikwizard.com/pw/medium/159fe11dfd694e4852783a85b0d2d4e6.jpg" style="margin: 0; width: 100%;" alt="" />
<p style="font-size: 12px; margin: 0;">PikWizard</p>
</a>
</span>
</span>
Free (free of charge)
Free for personal and commercial use.
Author: Authentic Images
Similar Free Stock Images

Premium


Premium


Premium

Premium


Premium


Premium


Premium


Premium

Premium


Premium
Premium


Premium


Premium


Premium


Premium

Premium


Premium


Premium


Premium


Premium


Premium


Premium


Premium


Premium

Premium


Explore More Free Stock Images