
- Home >
- Stock Photos >
- Power Lines and Graphs Showcasing Energy Analytics
Power Lines and Graphs Showcasing Energy Analytics Image
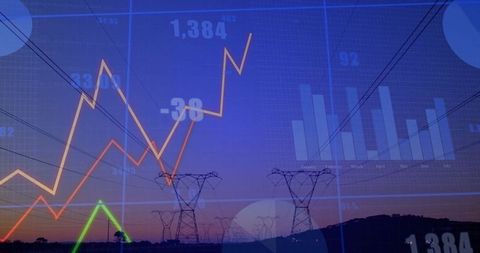
This visual juxtaposes power lines against graphical data representation, ideal for illustrating energy analytics or the intersection of technology and infrastructure. Suitable for use in reports, presentations, and articles discussing energy trends, technological advancements in power management, or highlighting the significance of data-driven decision-making in infrastructure.

downloads
Tags:
More
Credit Photo
If you would like to credit the Photo, here are some ways you can do so
Text Link
photo Link
<span class="text-link">
<span>
<a target="_blank" href=https://pikwizard.com/photo/power-lines-and-graphs-showcasing-energy-analytics/64005e50957a4fdbeb00f157cd5ab568/>PikWizard</a>
</span>
</span>
<span class="image-link">
<span
style="margin: 0 0 20px 0; display: inline-block; vertical-align: middle; width: 100%;"
>
<a
target="_blank"
href="https://pikwizard.com/photo/power-lines-and-graphs-showcasing-energy-analytics/64005e50957a4fdbeb00f157cd5ab568/"
style="text-decoration: none; font-size: 10px; margin: 0;"
>
<img src="https://pikwizard.com/pw/medium/64005e50957a4fdbeb00f157cd5ab568.jpg" style="margin: 0; width: 100%;" alt="" />
<p style="font-size: 12px; margin: 0;">PikWizard</p>
</a>
</span>
</span>
Free (free of charge)
Free for personal and commercial use.
Author: Awesome Content