
- Home >
- Stock Photos >
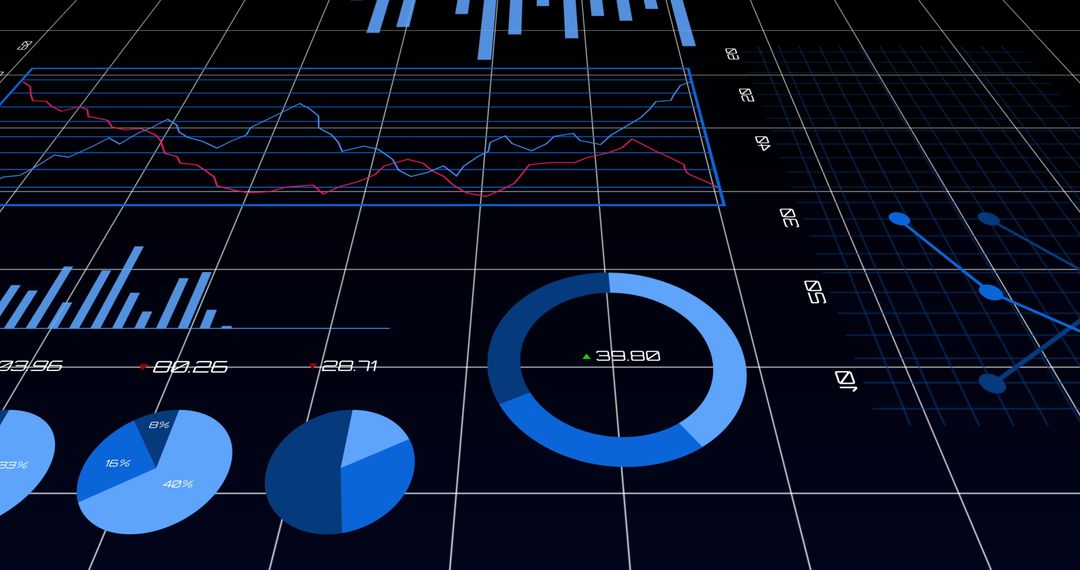
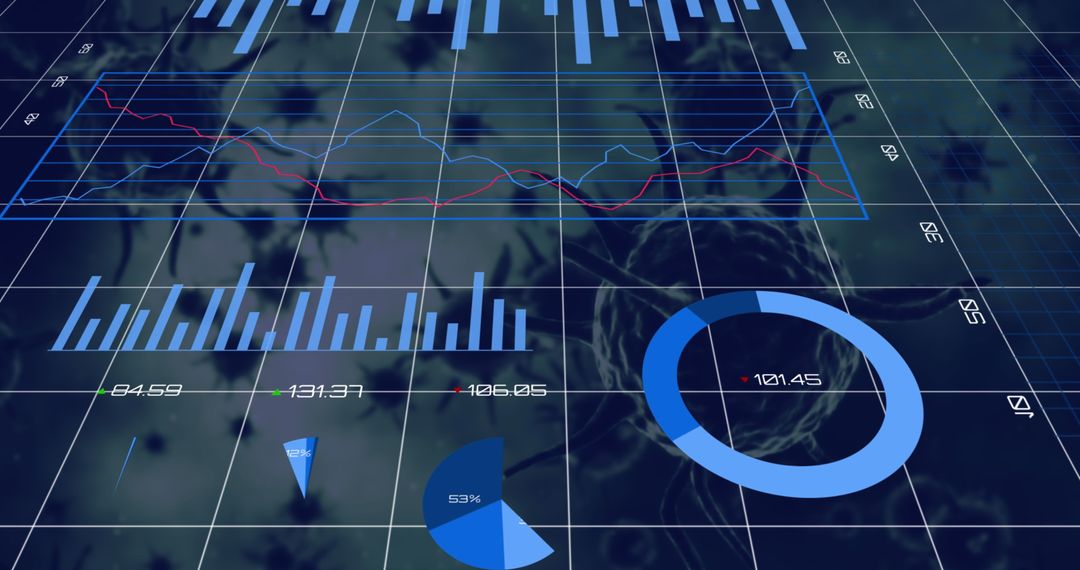
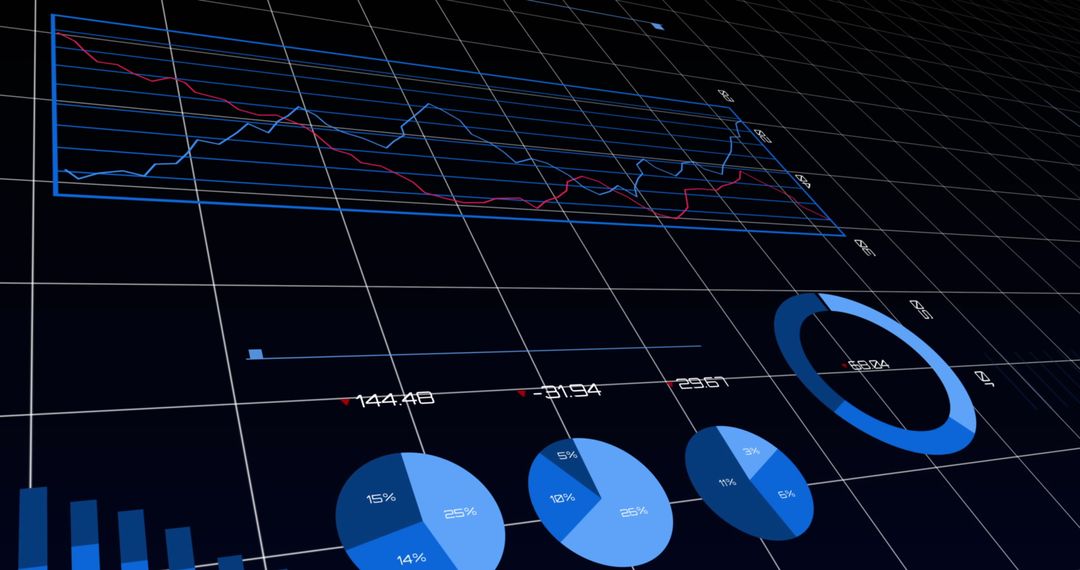
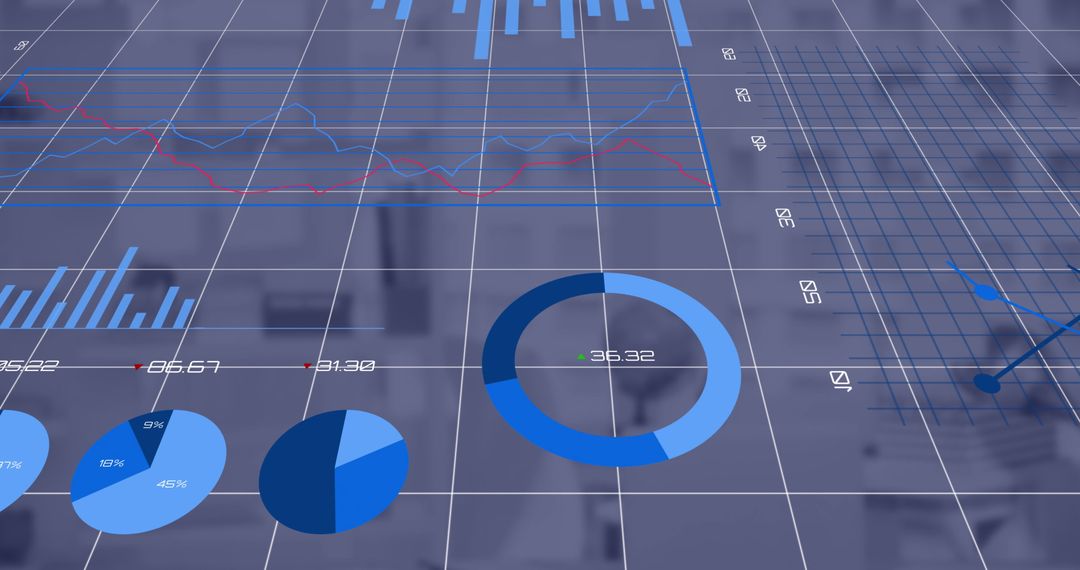
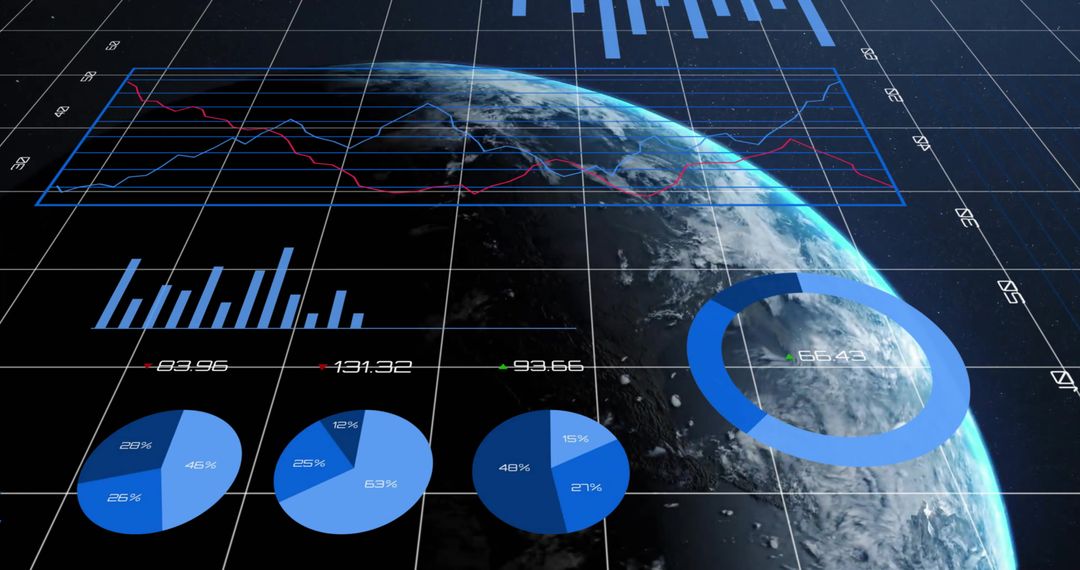
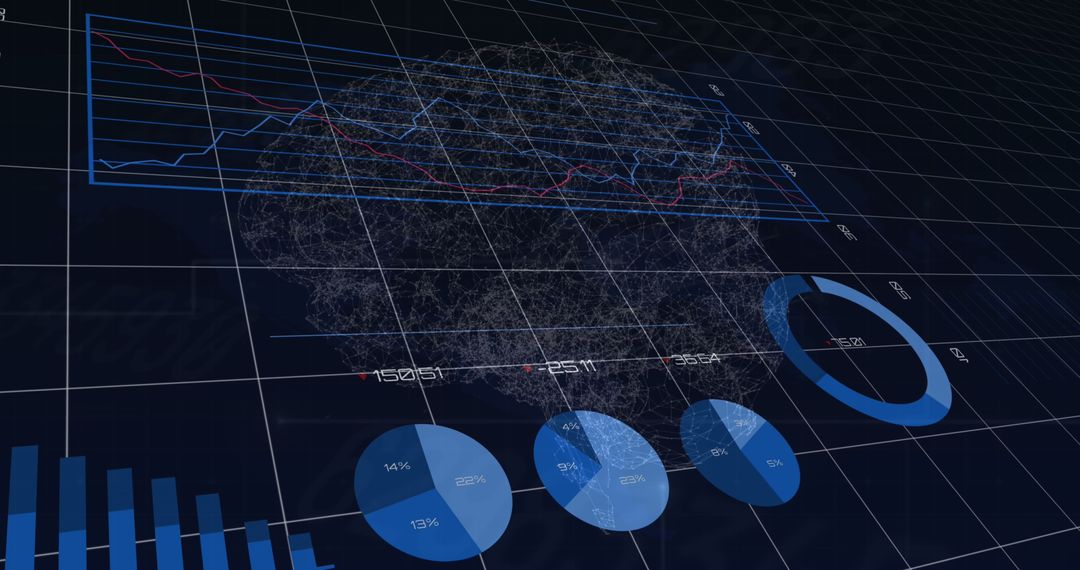
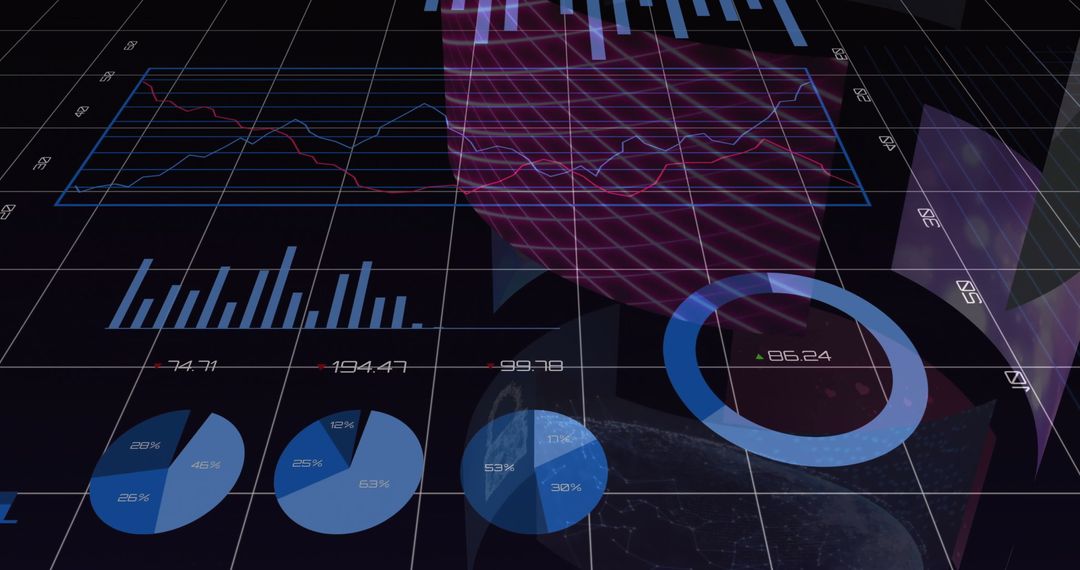
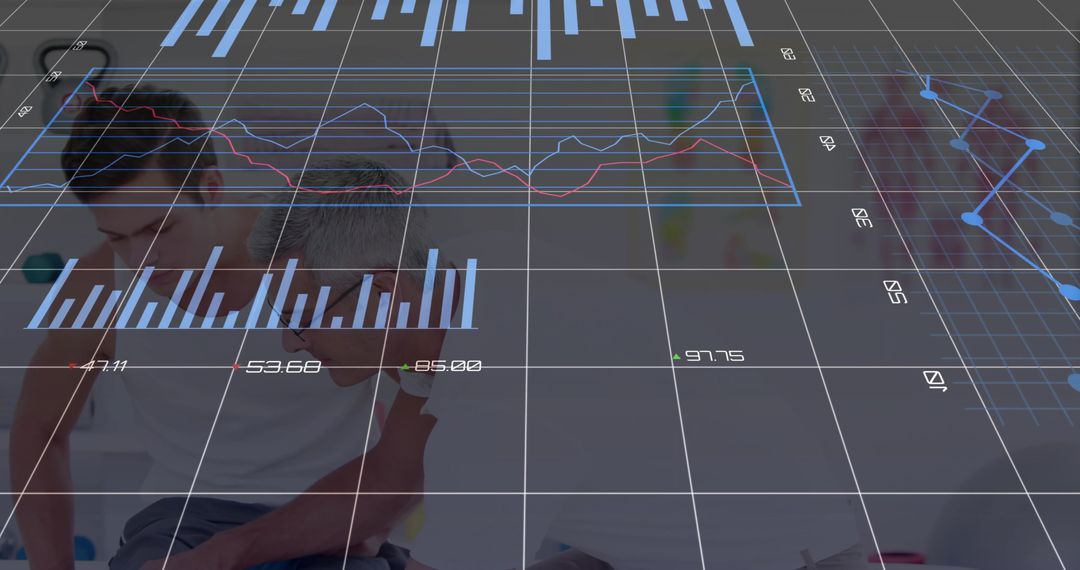
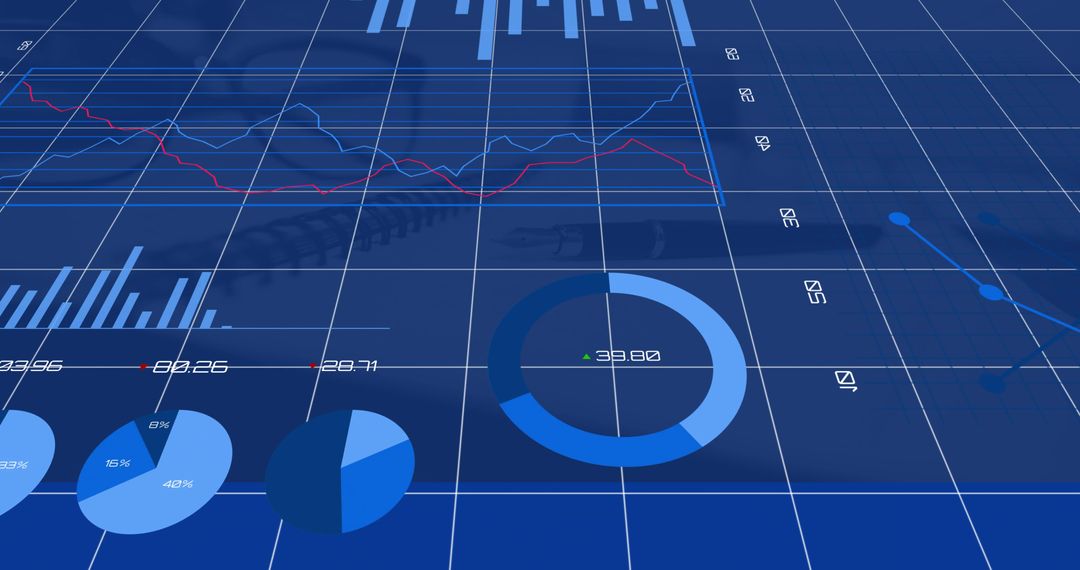
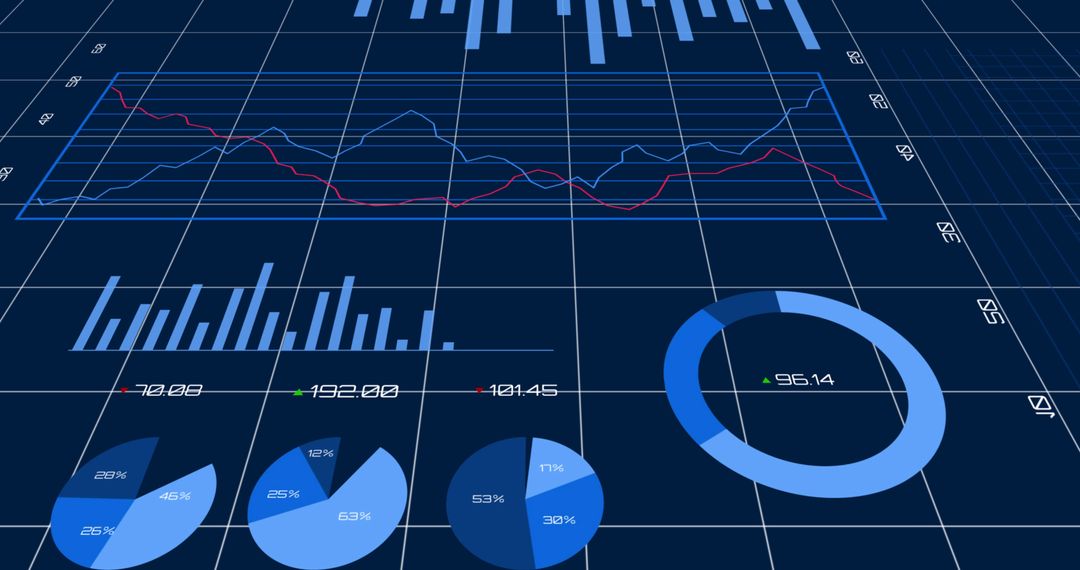
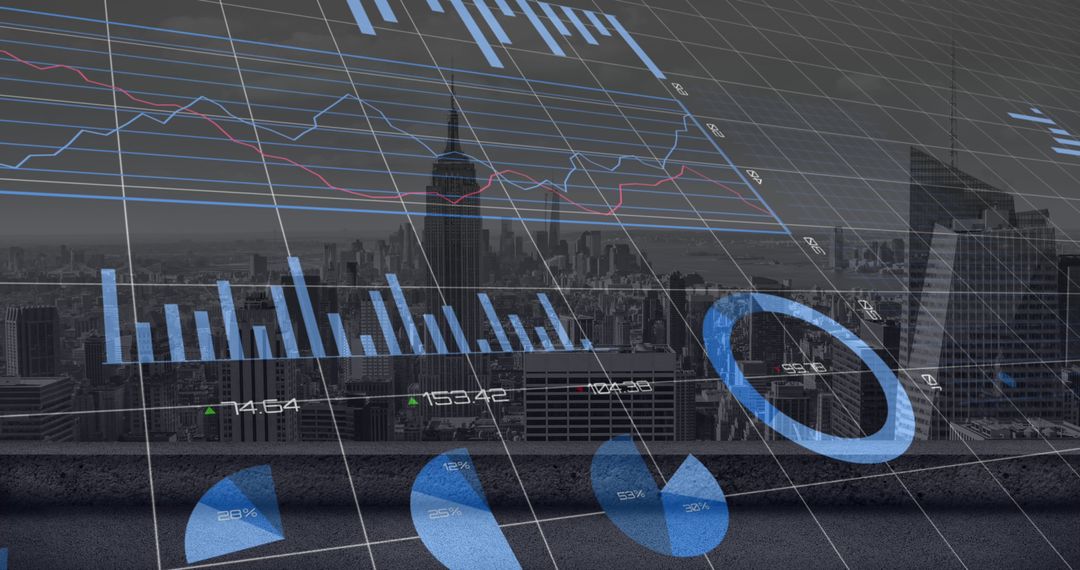
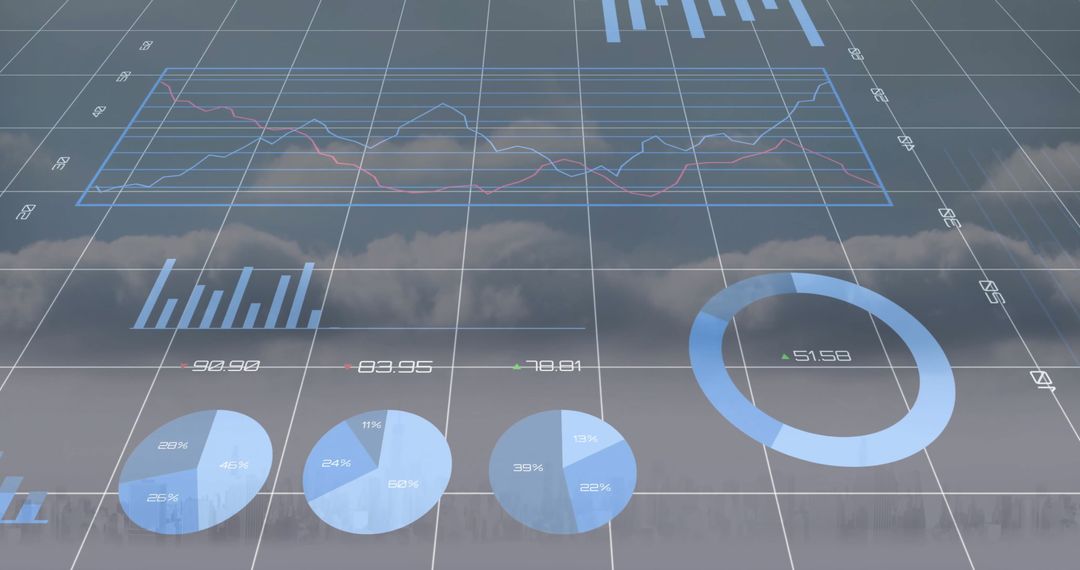
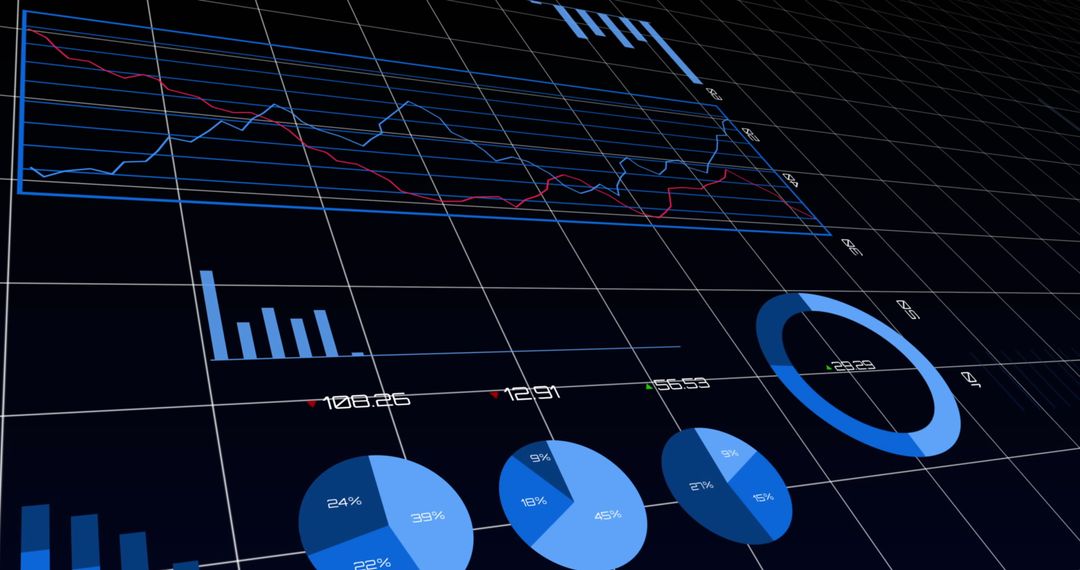
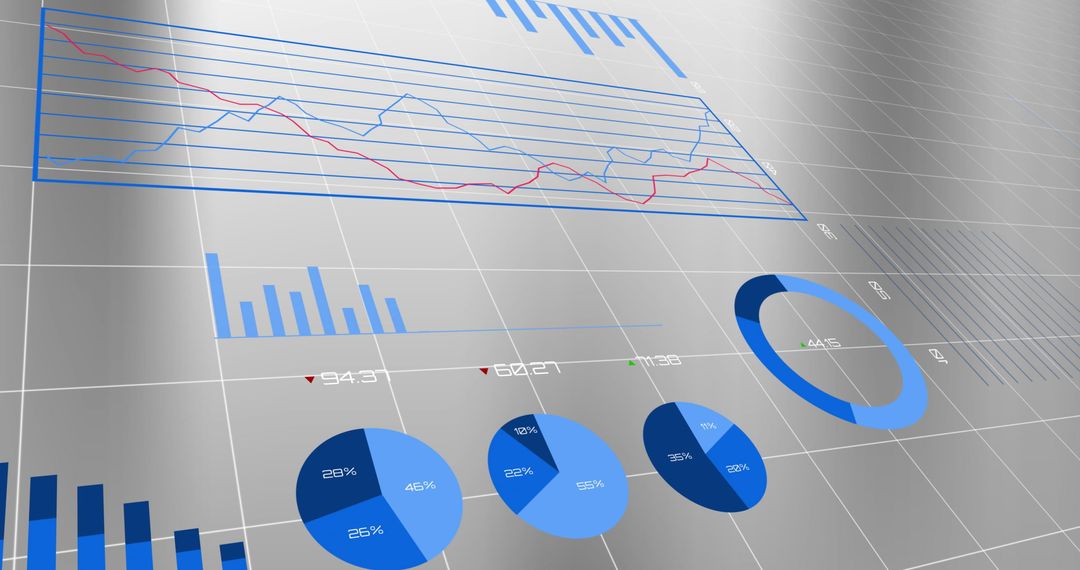
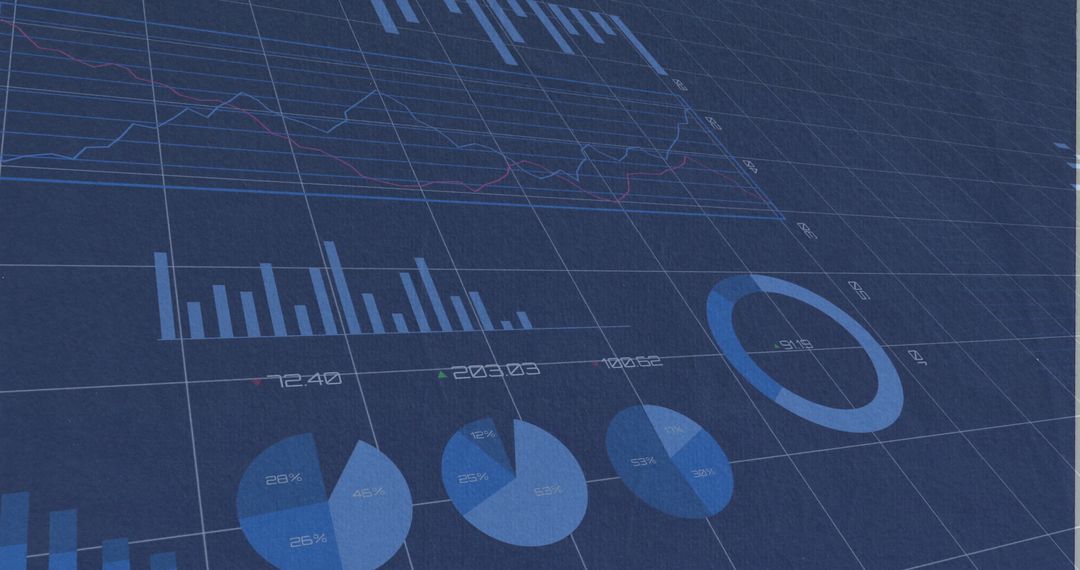
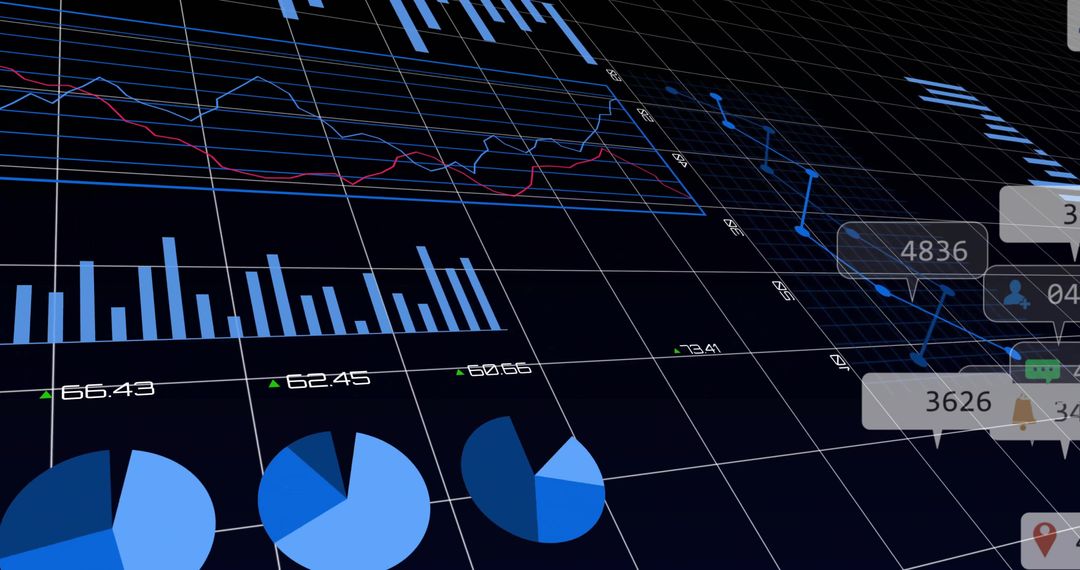
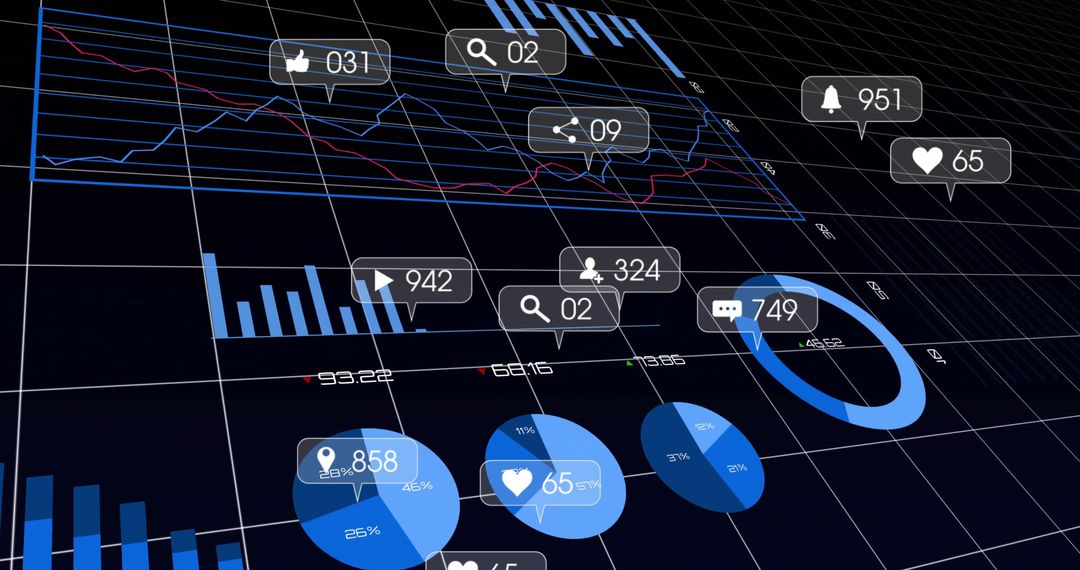
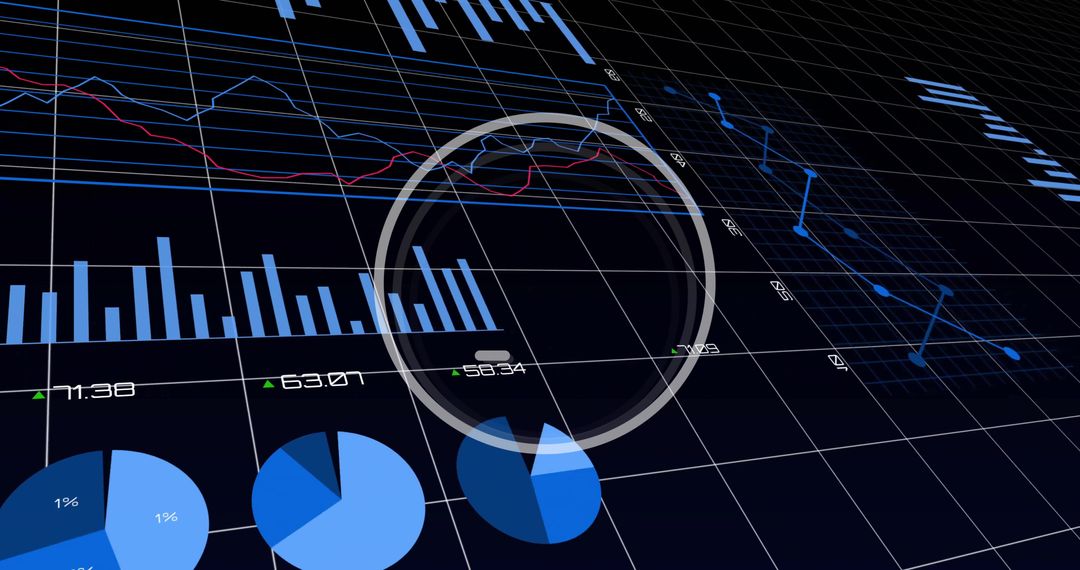
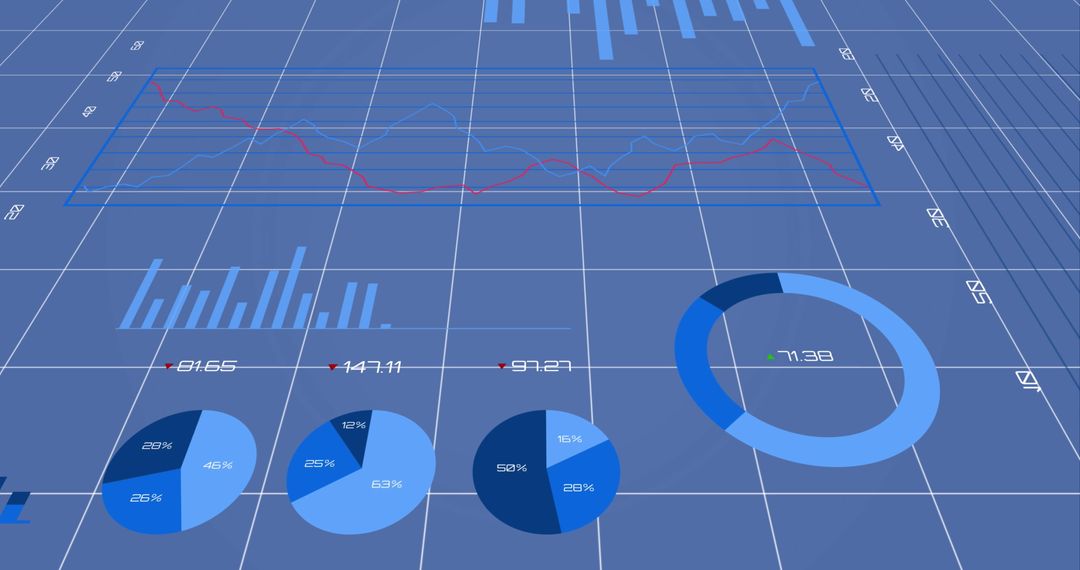
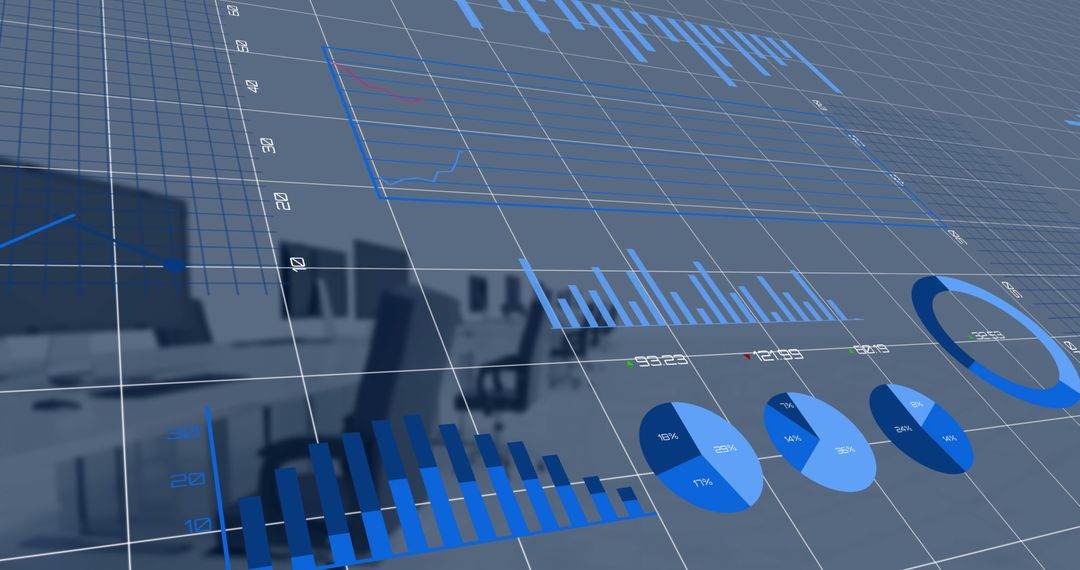
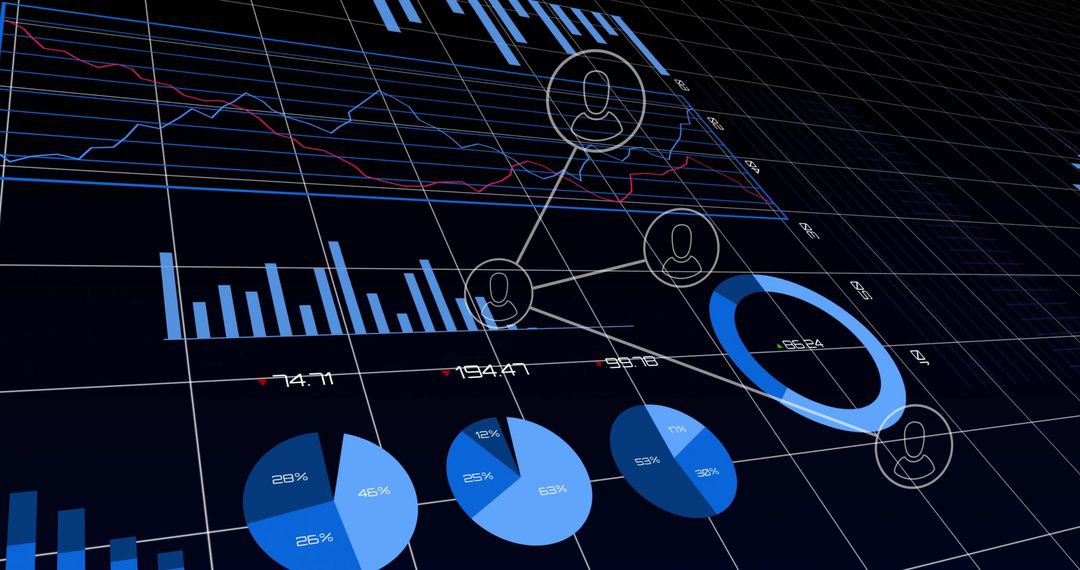
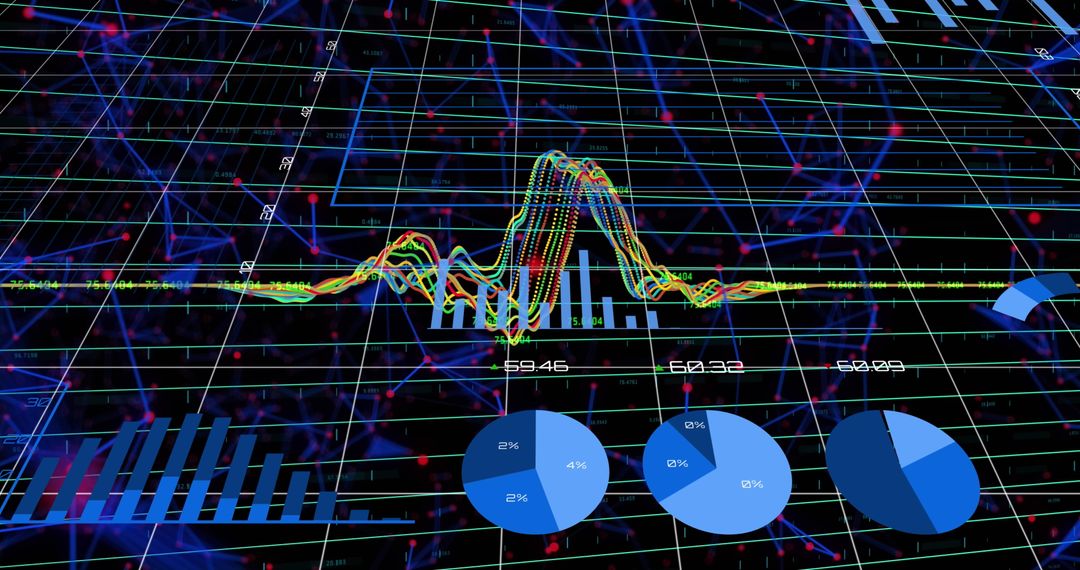
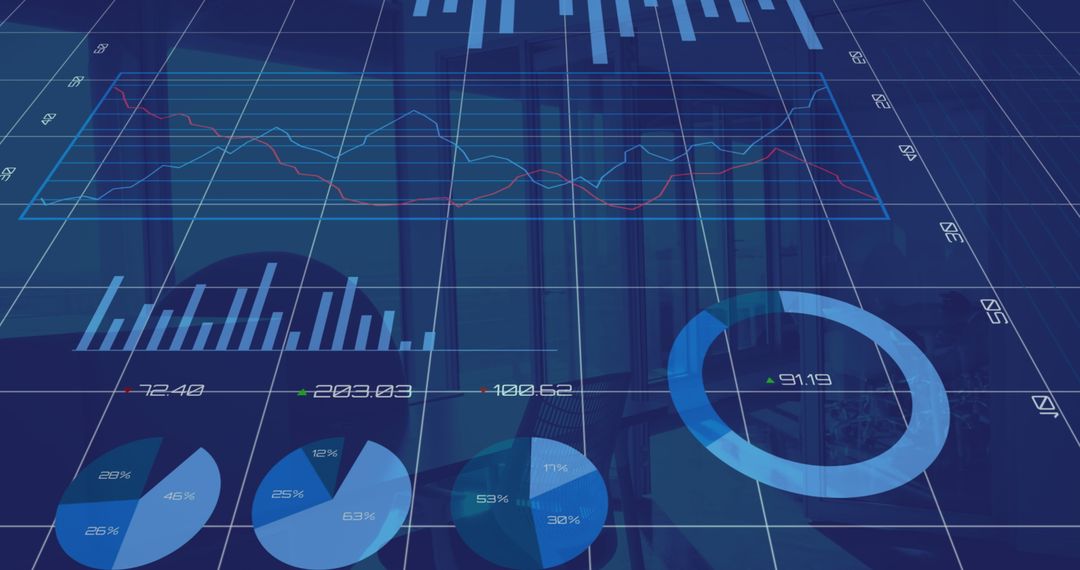
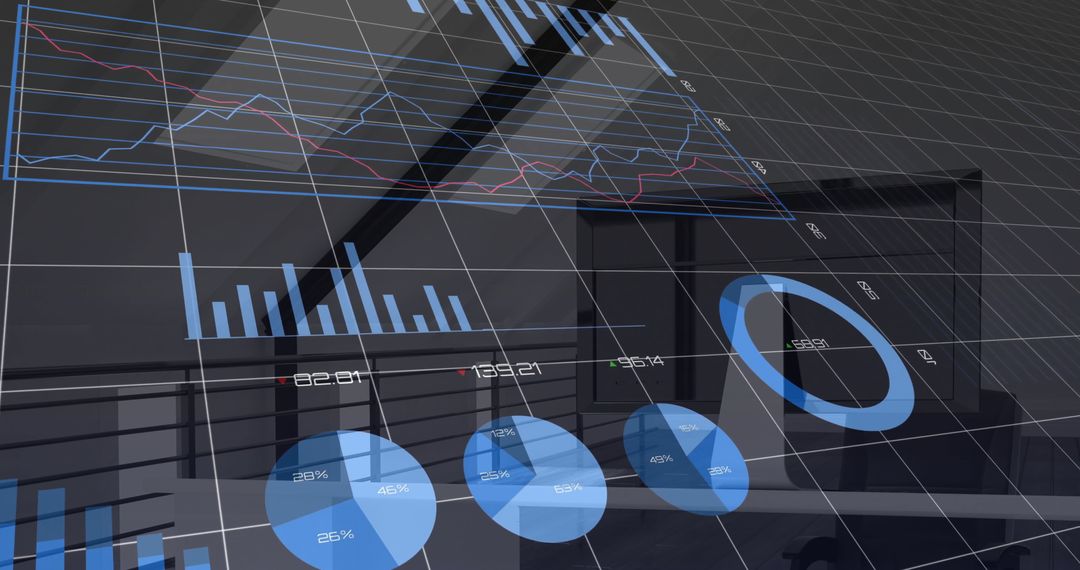
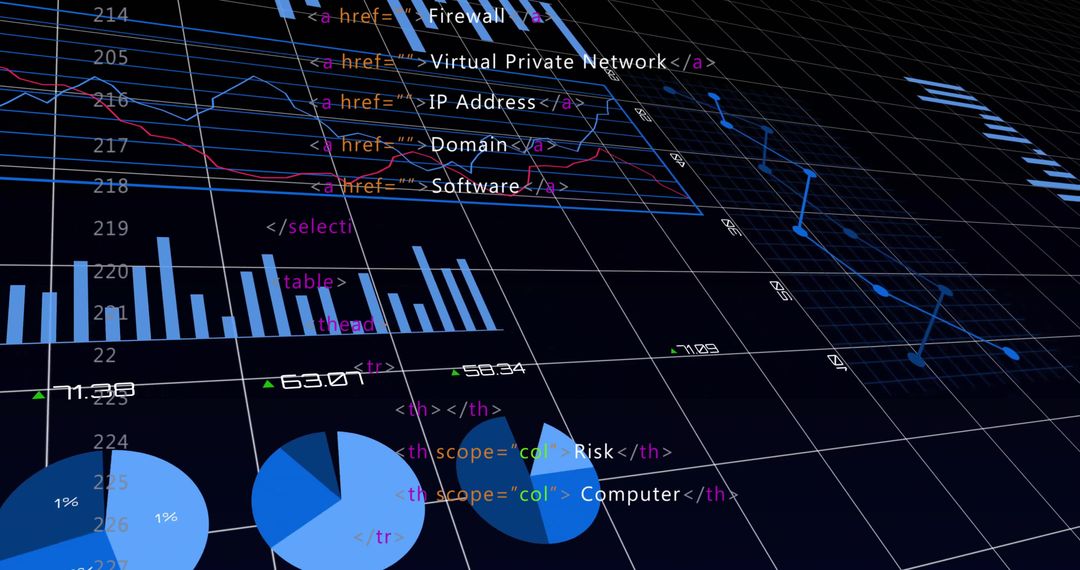
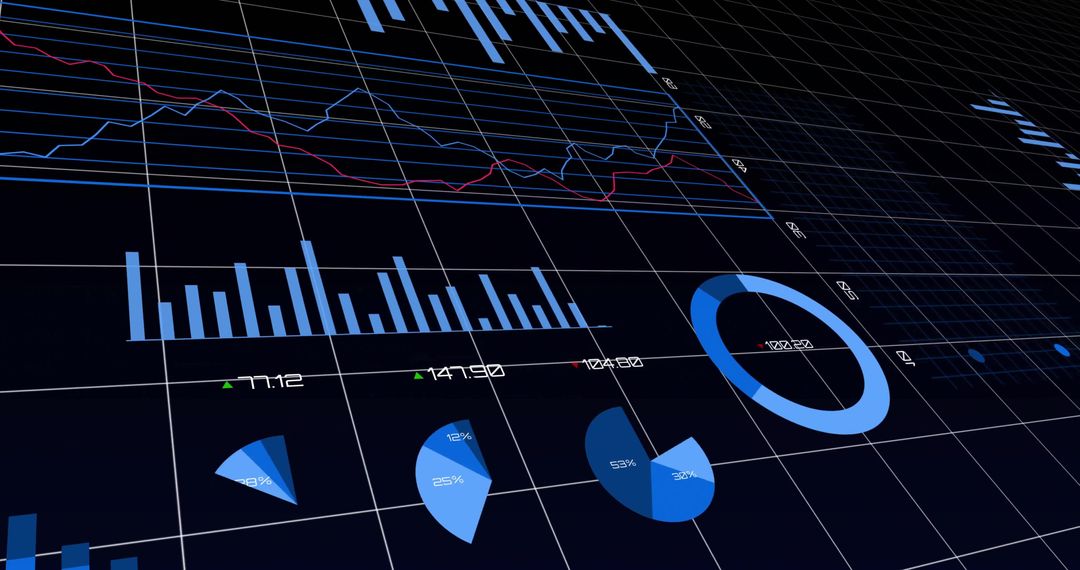
- Presenting 3D Neon Data Dashboard Displaying Bar Line Pie Donut Charts on Dark Grid
Presenting 3D Neon Data Dashboard Displaying Bar Line Pie Donut Charts on Dark Grid Image

Featuring tilted grid perspective and glowing neon blue graphics, showing layered bar and line charts alongside pie and donut charts with connecting network lines. Ideal for illustrating data-driven stories, showing market trends, supporting fintech branding, enhancing corporate reports, and powering slide decks or website hero headers. Leave space for headline or overlay text in top-right quadrant; pair with white or neon accent colors for high contrast. Suitable for web banners, social posts, investor presentations, annual reports, UI mockups, and background for dashboards or analytics pages.
Powered by 


0
downloads
downloads
Tags:
More
Credit Photo
If you would like to credit the Photo, here are some ways you can do so
Text Link
photo Link
<span class="text-link">
<span>
<a target="_blank" href=https://pikwizard.com/photo/presenting-3d-neon-data-dashboard-displaying-bar-line-pie-donut-charts-on-dark-grid/d64e4bbd529f52a94200278f02f6ef29/>PikWizard</a>
</span>
</span>
<span class="image-link">
<span
style="margin: 0 0 20px 0; display: inline-block; vertical-align: middle; width: 100%;"
>
<a
target="_blank"
href="https://pikwizard.com/photo/presenting-3d-neon-data-dashboard-displaying-bar-line-pie-donut-charts-on-dark-grid/d64e4bbd529f52a94200278f02f6ef29/"
style="text-decoration: none; font-size: 10px; margin: 0;"
>
<img src="https://pikwizard.com/pw/medium/d64e4bbd529f52a94200278f02f6ef29.jpg" style="margin: 0; width: 100%;" alt="" />
<p style="font-size: 12px; margin: 0;">PikWizard</p>
</a>
</span>
</span>
Free (free of charge)
Free for personal and commercial use.
Author: Creative Art
Similar Free Stock Images
Premium


Premium

Premium


Premium


Premium

Premium


Premium


Premium


Premium


Premium


Premium


Premium


Premium


Premium


Premium


Premium


Premium


Premium


Premium


Premium


Premium


Premium

Premium


Premium

