
- Home >
- Stock Photos >
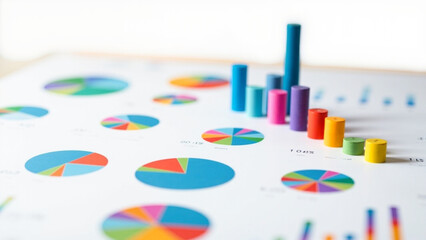
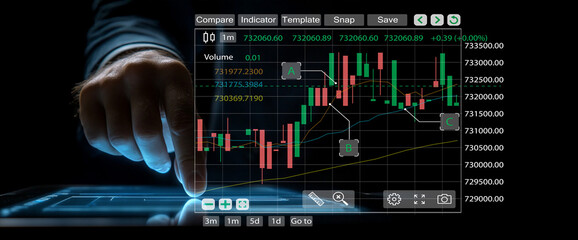
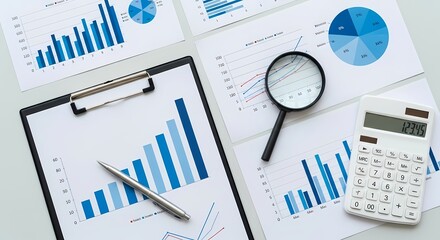
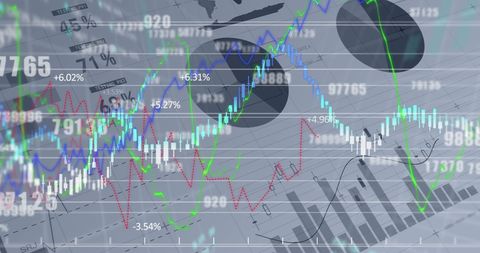
- Professional Analyzing Complex Financial Data on Multiple Screens
Professional Analyzing Complex Financial Data on Multiple Screens Image

Ideal for showcasing financial analysis expertise in business magazines and websites. Useful for illustrating content about data analysis, investment trends, or trading strategies.
Powered by 


downloads
Tags:
More
Credit Photo
If you would like to credit the Photo, here are some ways you can do so
Text Link
photo Link
<span class="text-link">
<span>
<a target="_blank" href=https://pikwizard.com/photo/professional-analyzing-complex-financial-data-on-multiple-screens/8dc30dba029af6f87363b8bbd57415c3/>PikWizard</a>
</span>
</span>
<span class="image-link">
<span
style="margin: 0 0 20px 0; display: inline-block; vertical-align: middle; width: 100%;"
>
<a
target="_blank"
href="https://pikwizard.com/photo/professional-analyzing-complex-financial-data-on-multiple-screens/8dc30dba029af6f87363b8bbd57415c3/"
style="text-decoration: none; font-size: 10px; margin: 0;"
>
<img src="https://pikwizard.com/pw/medium/8dc30dba029af6f87363b8bbd57415c3.jpg" style="margin: 0; width: 100%;" alt="" />
<p style="font-size: 12px; margin: 0;">PikWizard</p>
</a>
</span>
</span>
Free (free of charge)
Free for personal and commercial use.
Author: Authentic Images
Similar Free Stock Images

Premium


Premium


Premium


Premium


Premium

Premium
Premium

Premium


Premium


Premium


Premium


Premium


Premium

Premium

Premium


Premium


Premium


Premium


Premium

Premium


Premium

Premium

Premium


Premium


Premium


Explore More Free Stock Images