
- Home >
- Stock Photos >
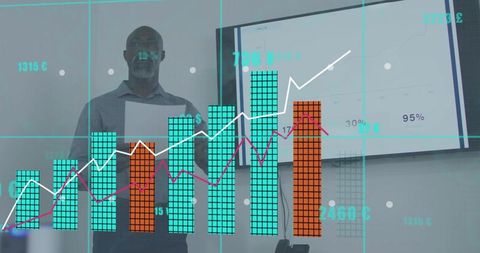
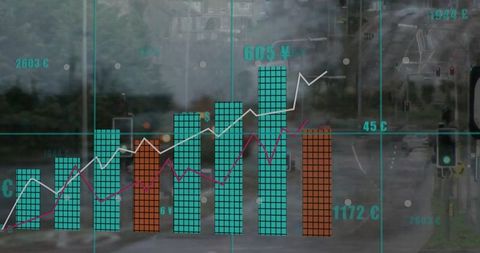
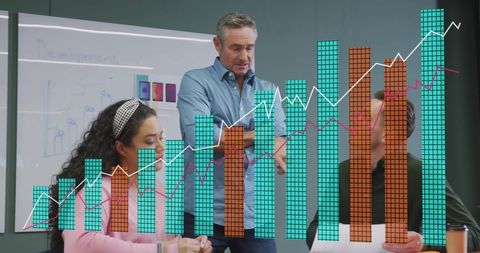
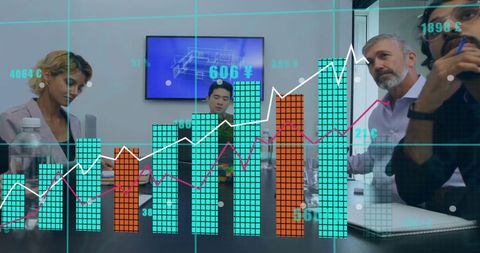
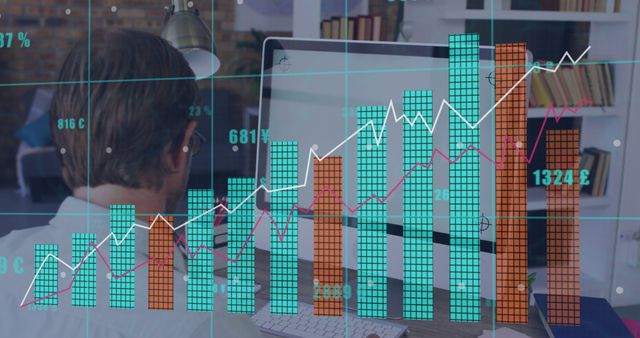
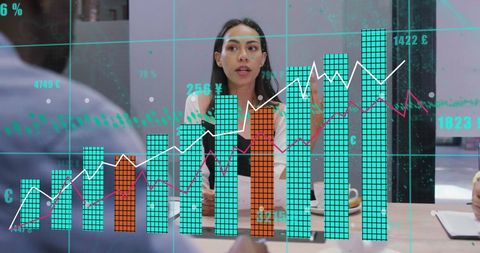
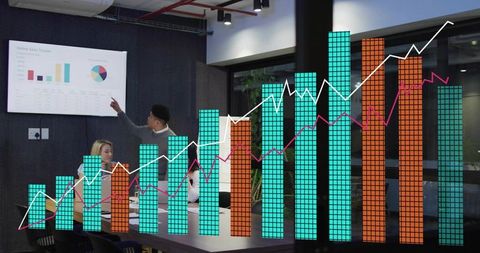
- Professional Man Analyzing Data Analytics Charts Concept
Professional Man Analyzing Data Analytics Charts Concept Image

This image of a man intently focused on analyzing digital charts encapsulates concepts such as data analysis and business intelligence. With its emphasis on modern financial technology and progress, it is ideal for use in blogs, articles, and presentations focused on financial analysis, market research, and business strategies. The minimalistic composition highlights concentration on analytics, making it apt for illustrating efficiency and modern data-driven decision-making.
Powered by 


downloads
Tags:
More
Credit Photo
If you would like to credit the Photo, here are some ways you can do so
Text Link
photo Link
<span class="text-link">
<span>
<a target="_blank" href=https://pikwizard.com/photo/professional-man-analyzing-data-analytics-charts-concept/4baafbdb3f96e77dc15def93d36fac48/>PikWizard</a>
</span>
</span>
<span class="image-link">
<span
style="margin: 0 0 20px 0; display: inline-block; vertical-align: middle; width: 100%;"
>
<a
target="_blank"
href="https://pikwizard.com/photo/professional-man-analyzing-data-analytics-charts-concept/4baafbdb3f96e77dc15def93d36fac48/"
style="text-decoration: none; font-size: 10px; margin: 0;"
>
<img src="https://pikwizard.com/pw/medium/4baafbdb3f96e77dc15def93d36fac48.jpg" style="margin: 0; width: 100%;" alt="" />
<p style="font-size: 12px; margin: 0;">PikWizard</p>
</a>
</span>
</span>
Free (free of charge)
Free for personal and commercial use.
Author: Authentic Images
Similar Free Stock Images

Premium


Premium


Premium


Premium


Premium


Premium


Premium

Premium


Premium

Premium


Premium


Premium


Premium


Premium


Premium


Premium


Premium


Premium


Premium


Premium


Premium


Premium


Premium


Premium


Premium


Explore More Free Stock Images