- Home >
- Stock Photos >
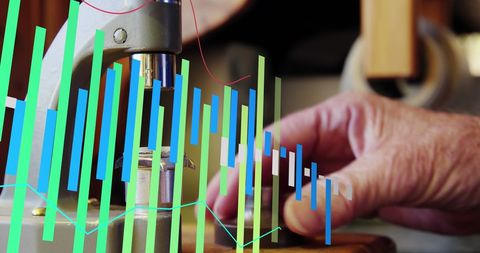
- Professional Typing Data on Laptop with Digital Graph Overlay
Professional Typing Data on Laptop with Digital Graph Overlay Image

Scene captures modern business environment with focus on data analytics. Hands typing indicate multitasking and productivity, while digital charts suggest use of advanced tools for data analysis. Useful for materials related to technology, business intelligence, corporate presentations, and articles on digital transformation.

downloads
Tags:
More
Credit Photo
If you would like to credit the Photo, here are some ways you can do so
Text Link
photo Link
<span class="text-link">
<span>
<a target="_blank" href=https://pikwizard.com/photo/professional-typing-data-on-laptop-with-digital-graph-overlay/60fe4df07d5b318f5c4f3df8f89cb4c8/>PikWizard</a>
</span>
</span>
<span class="image-link">
<span
style="margin: 0 0 20px 0; display: inline-block; vertical-align: middle; width: 100%;"
>
<a
target="_blank"
href="https://pikwizard.com/photo/professional-typing-data-on-laptop-with-digital-graph-overlay/60fe4df07d5b318f5c4f3df8f89cb4c8/"
style="text-decoration: none; font-size: 10px; margin: 0;"
>
<img src="https://pikwizard.com/pw/medium/60fe4df07d5b318f5c4f3df8f89cb4c8.jpg" style="margin: 0; width: 100%;" alt="" />
<p style="font-size: 12px; margin: 0;">PikWizard</p>
</a>
</span>
</span>
Free (free of charge)
Free for personal and commercial use.
Author: Creative Art