- Home >
- Stock Photos >
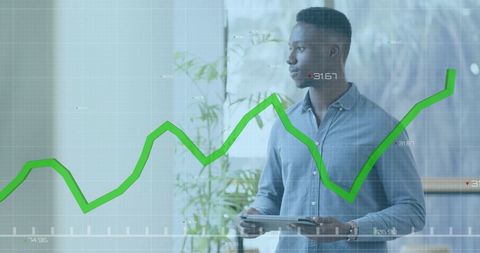
- Professionally Presenting Financial Data with Interactive Charts
Professionally Presenting Financial Data with Interactive Charts Image

A businessman in casual attire stands in an office holding a tablet. He is pointing at financial graphs on the wall, indicating business growth and data analysis. The depicted scenario emphasizes professional insight, decision-making, and economic strategy. This concept can be effectively used in business presentations, finance consulting, and educational materials to exemplify data analysis and strategic planning.

downloads
Tags:
More
Credit Photo
If you would like to credit the Photo, here are some ways you can do so
Text Link
photo Link
<span class="text-link">
<span>
<a target="_blank" href=https://pikwizard.com/photo/professionally-presenting-financial-data-with-interactive-charts/b4662eb8598df727d9f5f7c0de411ae0/>PikWizard</a>
</span>
</span>
<span class="image-link">
<span
style="margin: 0 0 20px 0; display: inline-block; vertical-align: middle; width: 100%;"
>
<a
target="_blank"
href="https://pikwizard.com/photo/professionally-presenting-financial-data-with-interactive-charts/b4662eb8598df727d9f5f7c0de411ae0/"
style="text-decoration: none; font-size: 10px; margin: 0;"
>
<img src="https://pikwizard.com/pw/medium/b4662eb8598df727d9f5f7c0de411ae0.jpg" style="margin: 0; width: 100%;" alt="" />
<p style="font-size: 12px; margin: 0;">PikWizard</p>
</a>
</span>
</span>
Free (free of charge)
Free for personal and commercial use.
Author: People Creations