
- Home >
- Stock Photos >
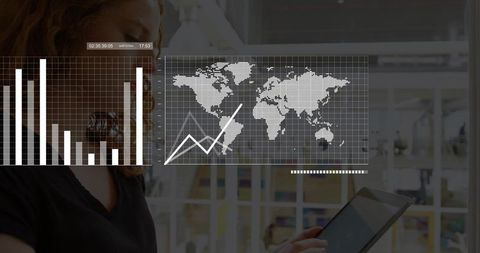
- Professionals using mobile devices at conference with translucent data visualization overlay
Professionals using mobile devices at conference with translucent data visualization overlay Image

Three professionals sitting in conference environment, one woman in light hoodie tapping smartphone while wearing wristwatch and lanyard. Translucent horizontal bar chart and data points overlaying scene, conveying dashboard analytics and real-time reporting. Cool blue color grading creating modern, tech-focused mood. Serving well in business presentations, SaaS and analytics product pages, digital transformation articles, corporate event promotion, training materials, and social media banners. Cropping for hero banner or slide background, placing headline text on left side, or combining with UI mockups for app demos.
Powered by  - Get 15% off with code: PIKWIZARD15


downloads
Tags:
More
Credit Photo
If you would like to credit the Photo, here are some ways you can do so
Text Link
photo Link
<span class="text-link">
<span>
<a target="_blank" href=https://pikwizard.com/photo/professionals-using-mobile-devices-at-conference-with-translucent-data-visualization-overlay/a1e29091d1b7dc6ebc21e07cfacffc1f/>PikWizard</a>
</span>
</span>
<span class="image-link">
<span
style="margin: 0 0 20px 0; display: inline-block; vertical-align: middle; width: 100%;"
>
<a
target="_blank"
href="https://pikwizard.com/photo/professionals-using-mobile-devices-at-conference-with-translucent-data-visualization-overlay/a1e29091d1b7dc6ebc21e07cfacffc1f/"
style="text-decoration: none; font-size: 10px; margin: 0;"
>
<img src="https://pikwizard.com/pw/medium/a1e29091d1b7dc6ebc21e07cfacffc1f.jpg" style="margin: 0; width: 100%;" alt="" />
<p style="font-size: 12px; margin: 0;">PikWizard</p>
</a>
</span>
</span>
Free (free of charge)
Free for personal and commercial use.
Author: Creative Art
Similar Free Stock Images

Premium


Premium


Premium


Premium


Premium


Premium


Premium


Premium


Premium


Premium

Premium


Premium


Premium


Premium

Premium


Premium


Premium


Premium


Premium


Premium


Premium


Premium


Premium


Premium


Premium


Explore More Free Stock Images