
- Home >
- Stock Photos >
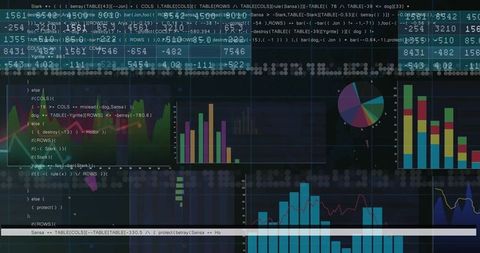
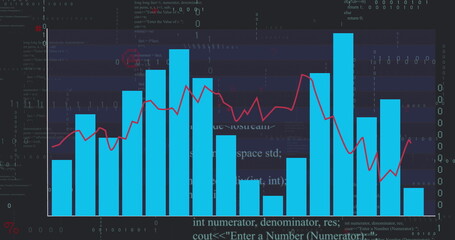
- Programming Interface with Code and Graph Analytics on Monitor
Programming Interface with Code and Graph Analytics on Monitor Image
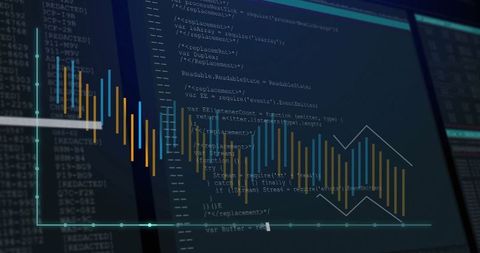
This image depicts a computer monitor displaying a code editor with elements of data analytics, including a bar chart and a line graph overlaid. The visual provides a glimpse into programming, data processing, and analytic visualization in a software environment. It can be useful for illustrating topics related to software engineering, data science, or modern user interfaces, highlighting concepts such as coding, data analysis, and interactive design.
Powered by 


downloads
Tags:
More
Credit Photo
If you would like to credit the Photo, here are some ways you can do so
Text Link
photo Link
<span class="text-link">
<span>
<a target="_blank" href=https://pikwizard.com/photo/programming-interface-with-code-and-graph-analytics-on-monitor/5cb36c7234b45e5e2a1c987f63214a70/>PikWizard</a>
</span>
</span>
<span class="image-link">
<span
style="margin: 0 0 20px 0; display: inline-block; vertical-align: middle; width: 100%;"
>
<a
target="_blank"
href="https://pikwizard.com/photo/programming-interface-with-code-and-graph-analytics-on-monitor/5cb36c7234b45e5e2a1c987f63214a70/"
style="text-decoration: none; font-size: 10px; margin: 0;"
>
<img src="https://pikwizard.com/pw/medium/5cb36c7234b45e5e2a1c987f63214a70.jpg" style="margin: 0; width: 100%;" alt="" />
<p style="font-size: 12px; margin: 0;">PikWizard</p>
</a>
</span>
</span>
Free (free of charge)
Free for personal and commercial use.
Author: Creative Art
Similar Free Stock Images

Premium


Premium


Premium


Premium


Premium

Premium

Premium


Premium


Premium


Premium


Premium


Premium


Premium

Premium


Premium


Premium


Premium


Premium

Premium


Premium


Premium


Premium


Premium


Premium

Premium

Explore More Free Stock Images