- Home >
- Stock Photos >
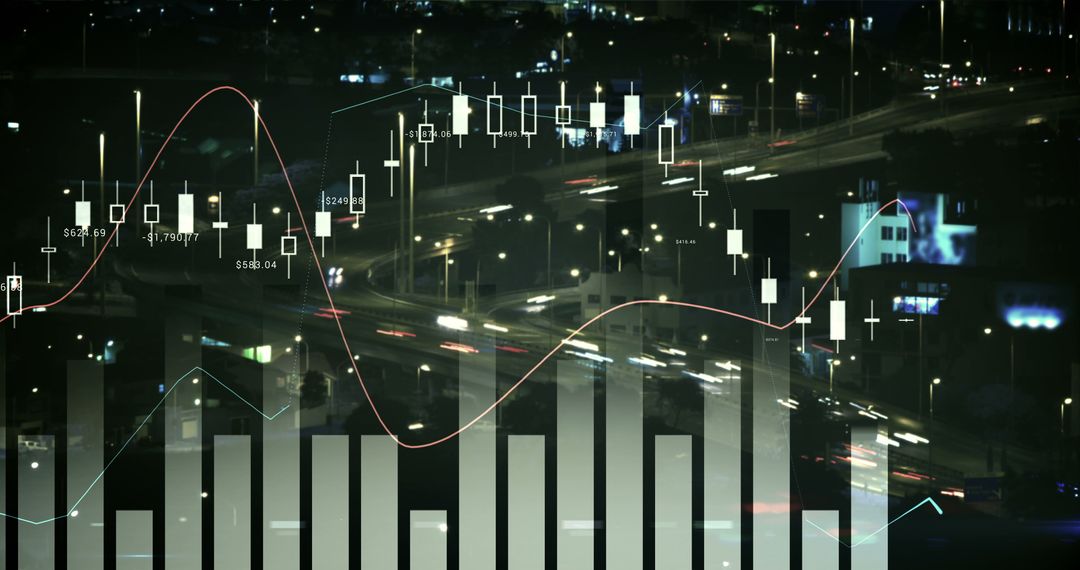
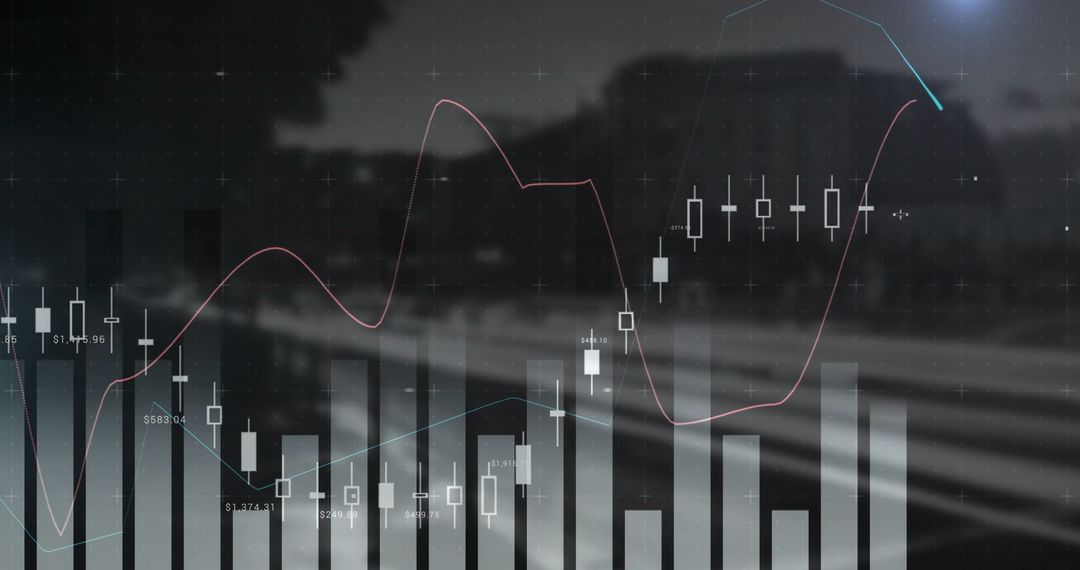
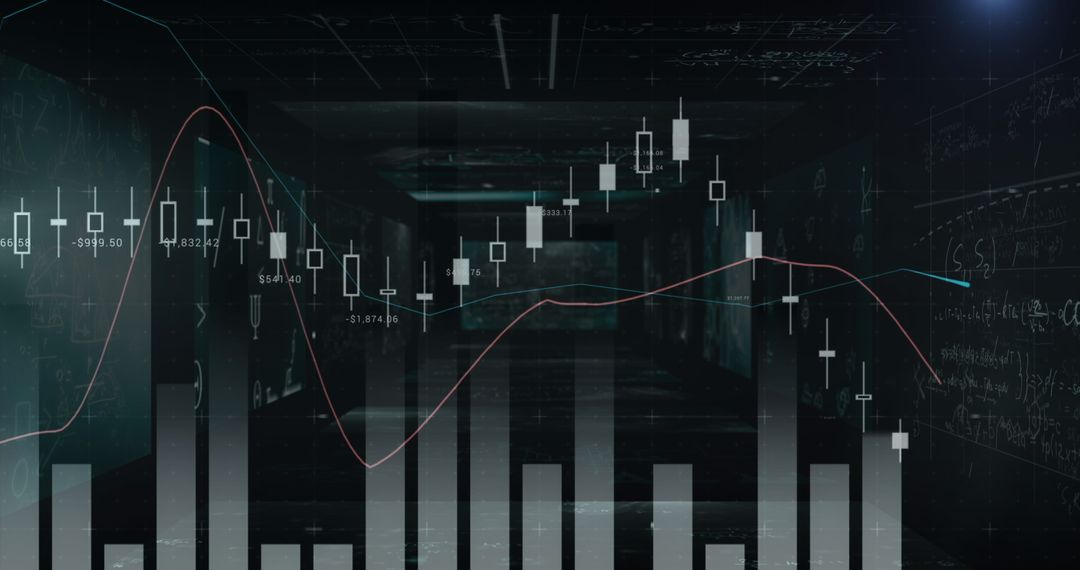
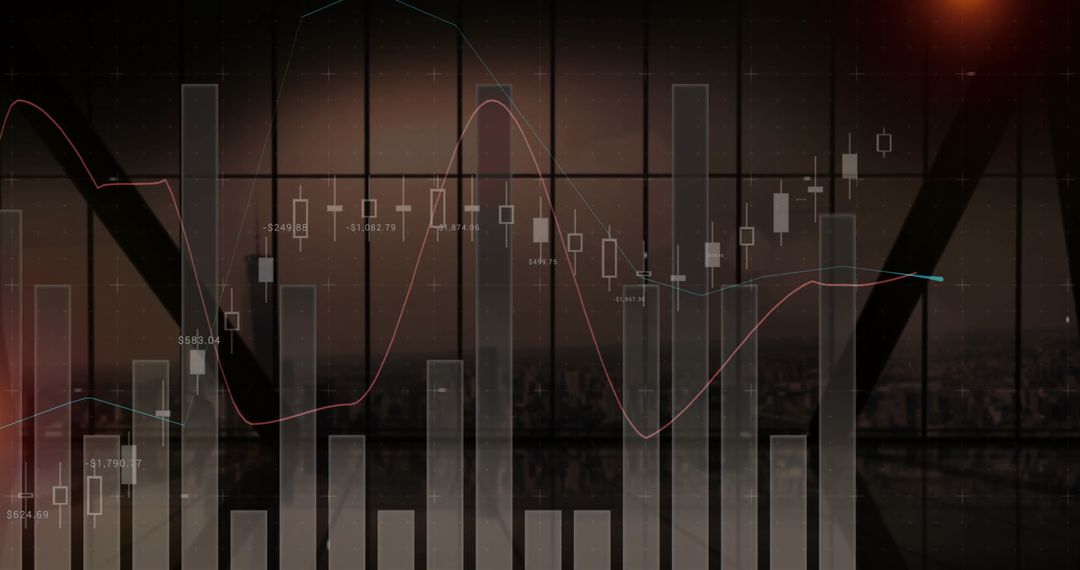
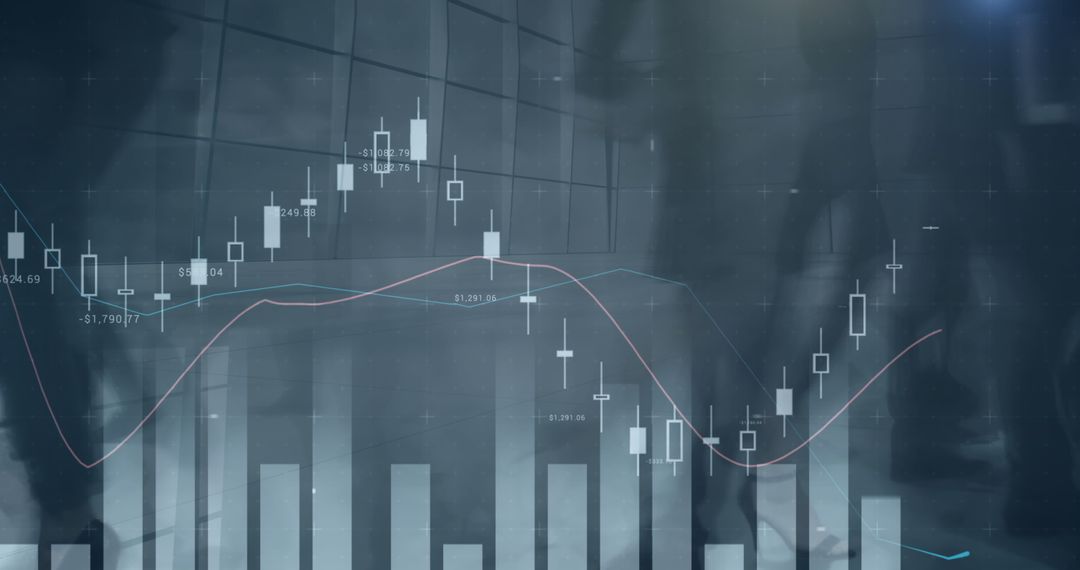
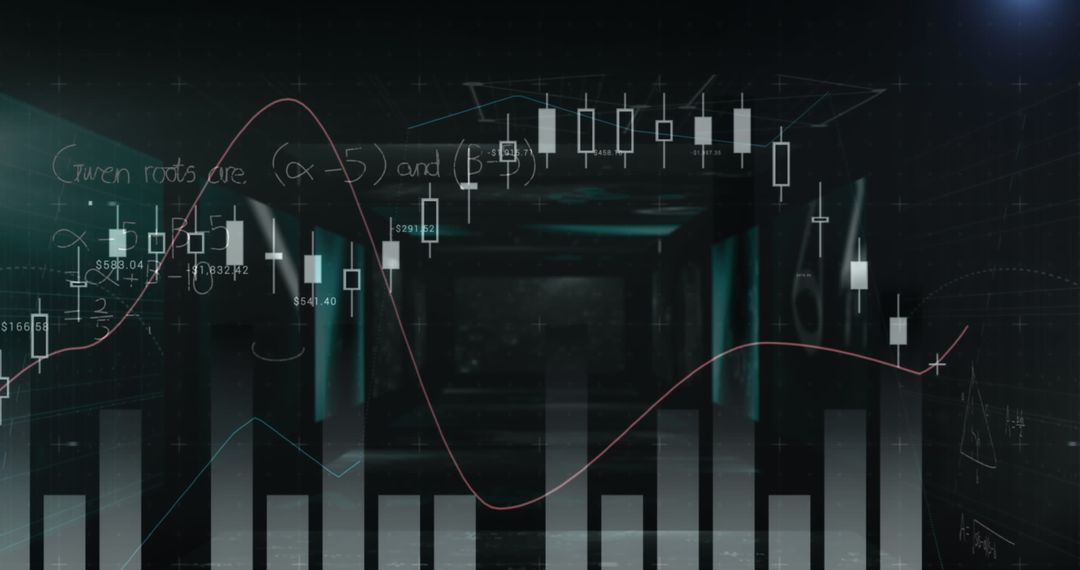
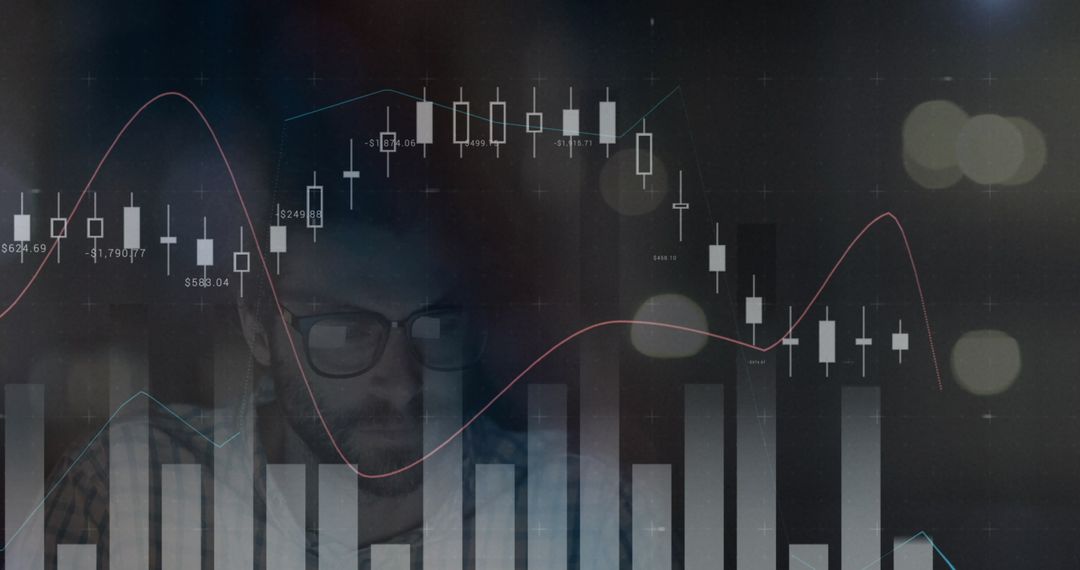
- Projecting Financial Charts Over Modern Architectural Corridor With Candlestick Graphs
Projecting Financial Charts Over Modern Architectural Corridor With Candlestick Graphs Image

Showing translucent candlestick chart, moving line graphs, and rising histogram bars layered over modern architectural corridor. Combining finance data with dramatic perspective and reflective blue tones for futuristic business aesthetics. Suiting websites, investor presentations, financial reports, fintech branding, trading platform interfaces, market analysis blogs, and corporate annual reports. Working well as hero banner, slide header, broadcast background, brochure cover, social media asset, or dashboard backdrop. Leaving negative space at center for headline and call-to-action. Providing high contrast for overlaying text and logos and allowing easy color grading to match brand palette. Licensing suitable for commercial and editorial use.
Powered by 


0
downloads
downloads
Tags:
More
Credit Photo
If you would like to credit the Photo, here are some ways you can do so
Text Link
photo Link
<span class="text-link">
<span>
<a target="_blank" href=https://pikwizard.com/photo/projecting-financial-charts-over-modern-architectural-corridor-with-candlestick-graphs/20c5abdb27ce8dcbbfe6bcf04fb2d415/>PikWizard</a>
</span>
</span>
<span class="image-link">
<span
style="margin: 0 0 20px 0; display: inline-block; vertical-align: middle; width: 100%;"
>
<a
target="_blank"
href="https://pikwizard.com/photo/projecting-financial-charts-over-modern-architectural-corridor-with-candlestick-graphs/20c5abdb27ce8dcbbfe6bcf04fb2d415/"
style="text-decoration: none; font-size: 10px; margin: 0;"
>
<img src="https://pikwizard.com/pw/medium/20c5abdb27ce8dcbbfe6bcf04fb2d415.jpg" style="margin: 0; width: 100%;" alt="" />
<p style="font-size: 12px; margin: 0;">PikWizard</p>
</a>
</span>
</span>
Free (free of charge)
Free for personal and commercial use.
Author: Awesome Content
Similar Free Stock Images

Premium


Premium


Premium


Premium


Premium


Premium


Premium


Premium


Premium


Premium


Premium


Premium


Premium


Premium


Premium


Premium


Premium


Premium


Premium


Premium


Premium


Premium


Premium


Premium