- Home >
- Stock Photos >
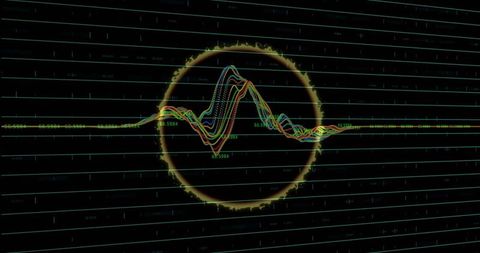
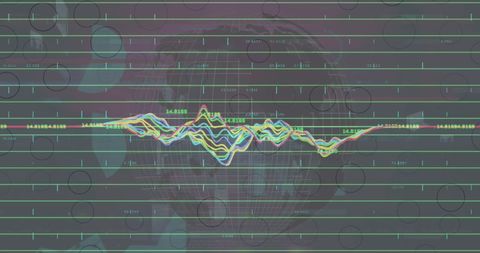
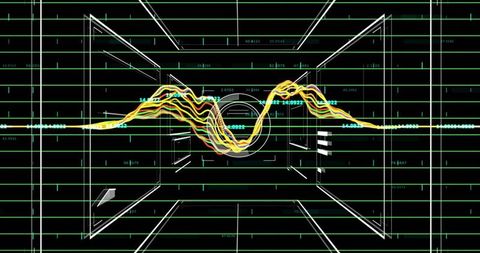
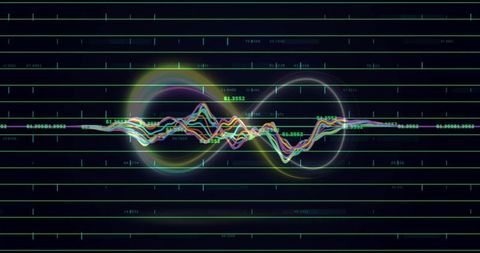
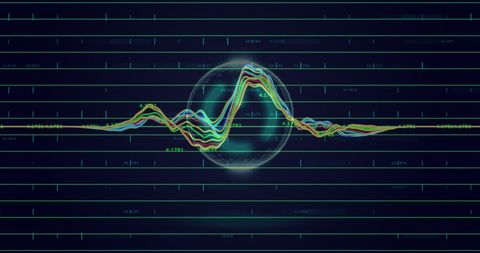
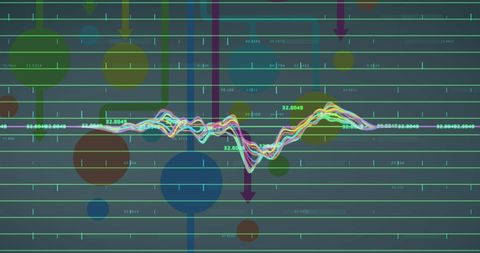
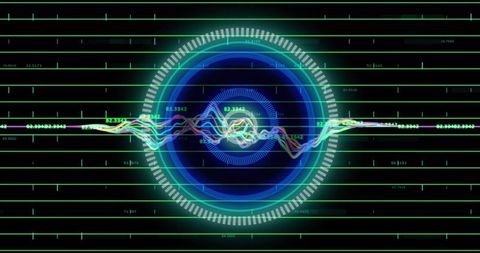
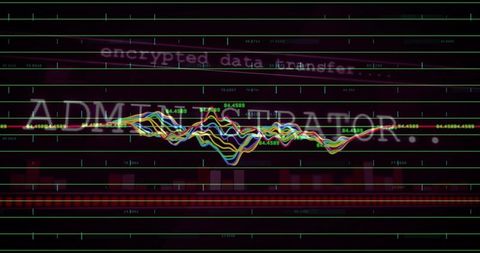
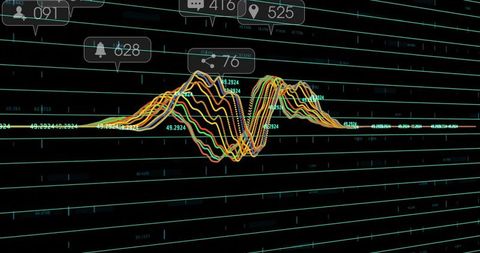
- Pulse Waveform Display with Connected Data Nodes on Grid
Pulse Waveform Display with Connected Data Nodes on Grid Image
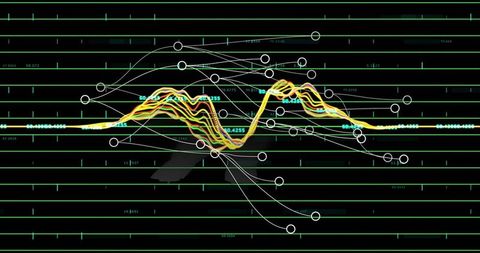
Illustrates a layered waveform on a digital interface with a grid pattern and connected nodes. Useful for technology presentations, data analysis visualizations, fintech dashboards, and cyber network illustrations. Effective in demonstrating complex data analysis and connectivity. Can enhance content related to technological advancements or digital network solutions.

downloads
Tags:
More
Credit Photo
If you would like to credit the Photo, here are some ways you can do so
Text Link
photo Link
<span class="text-link">
<span>
<a target="_blank" href=https://pikwizard.com/photo/pulse-waveform-display-with-connected-data-nodes-on-grid/ef3cadbbd80c10d4279e737cddd15a92/>PikWizard</a>
</span>
</span>
<span class="image-link">
<span
style="margin: 0 0 20px 0; display: inline-block; vertical-align: middle; width: 100%;"
>
<a
target="_blank"
href="https://pikwizard.com/photo/pulse-waveform-display-with-connected-data-nodes-on-grid/ef3cadbbd80c10d4279e737cddd15a92/"
style="text-decoration: none; font-size: 10px; margin: 0;"
>
<img src="https://pikwizard.com/pw/medium/ef3cadbbd80c10d4279e737cddd15a92.jpg" style="margin: 0; width: 100%;" alt="" />
<p style="font-size: 12px; margin: 0;">PikWizard</p>
</a>
</span>
</span>
Free (free of charge)
Free for personal and commercial use.
Author: Authentic Images