- Home >
- Stock Photos >
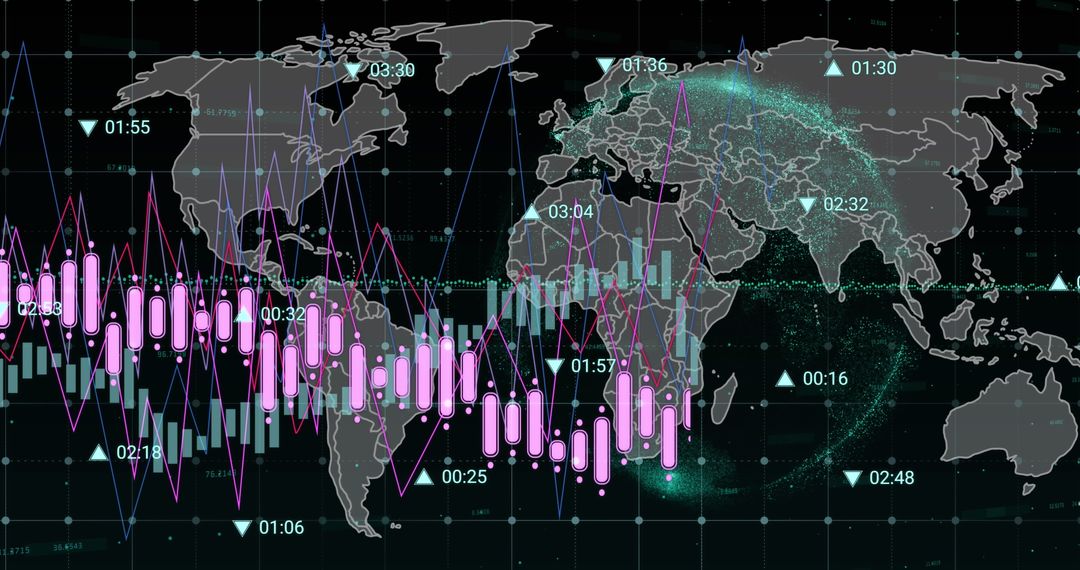
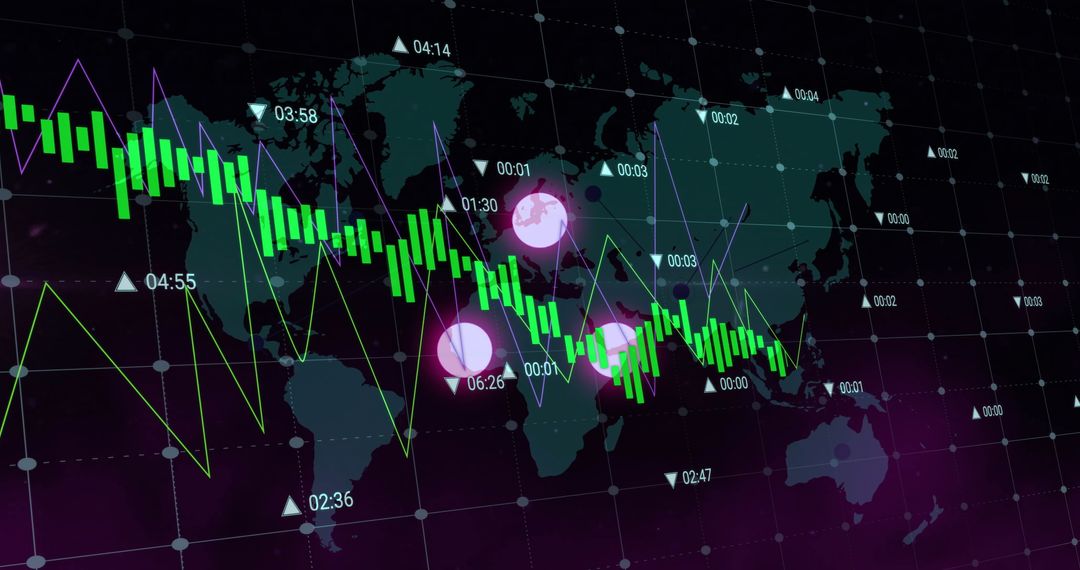
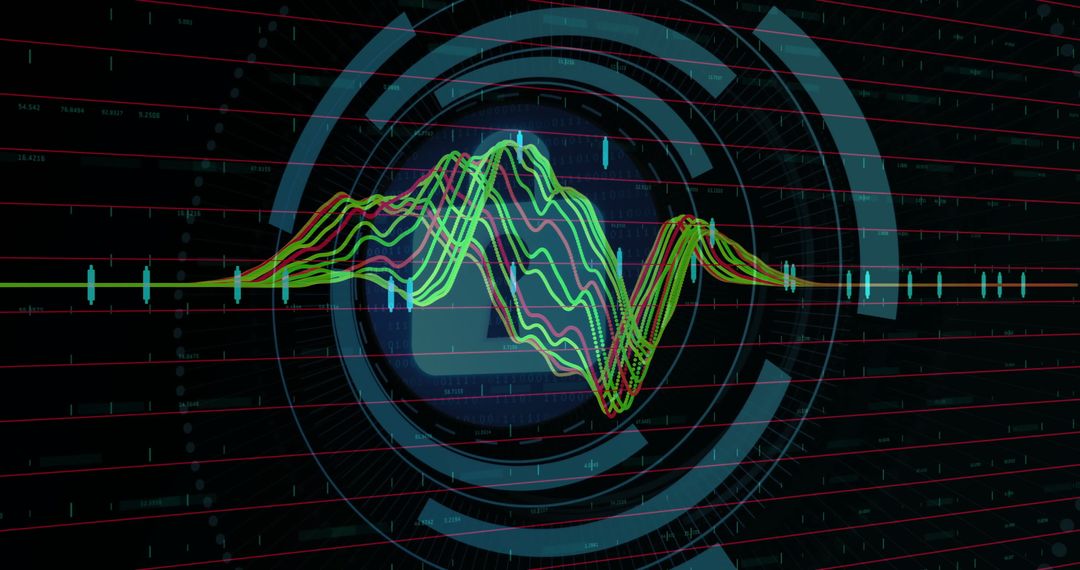
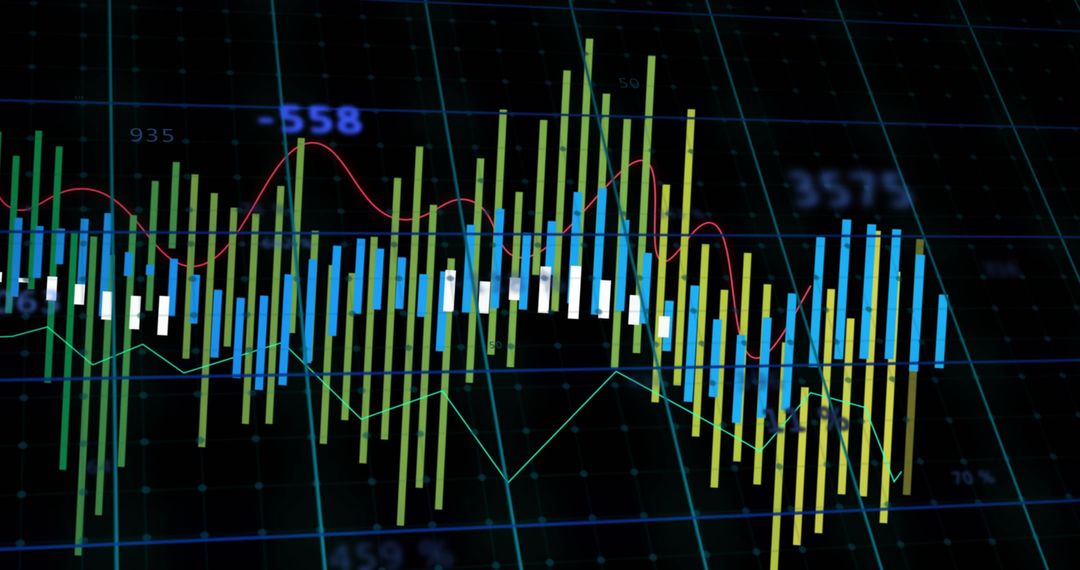
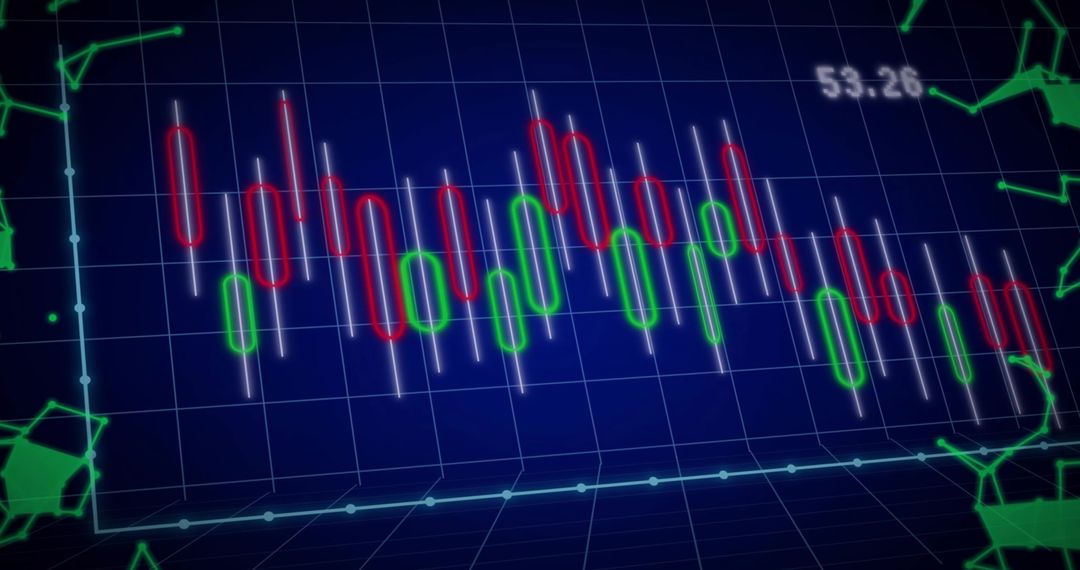
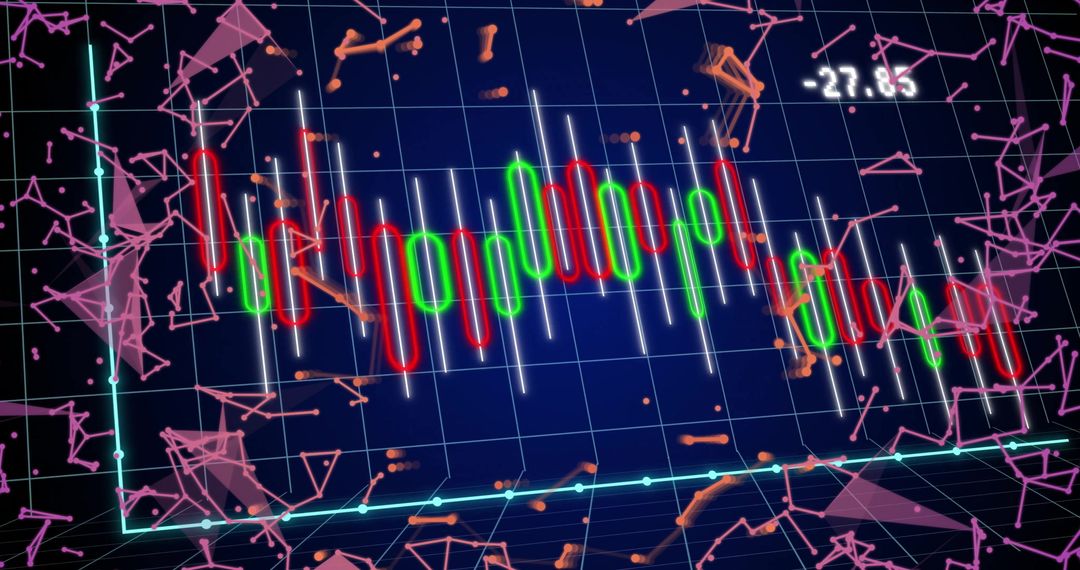
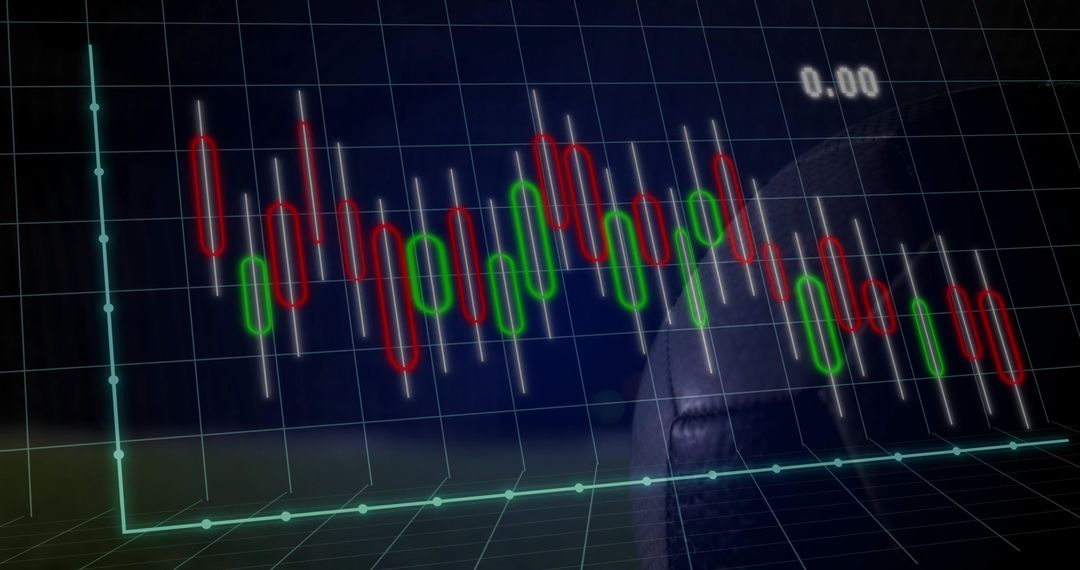
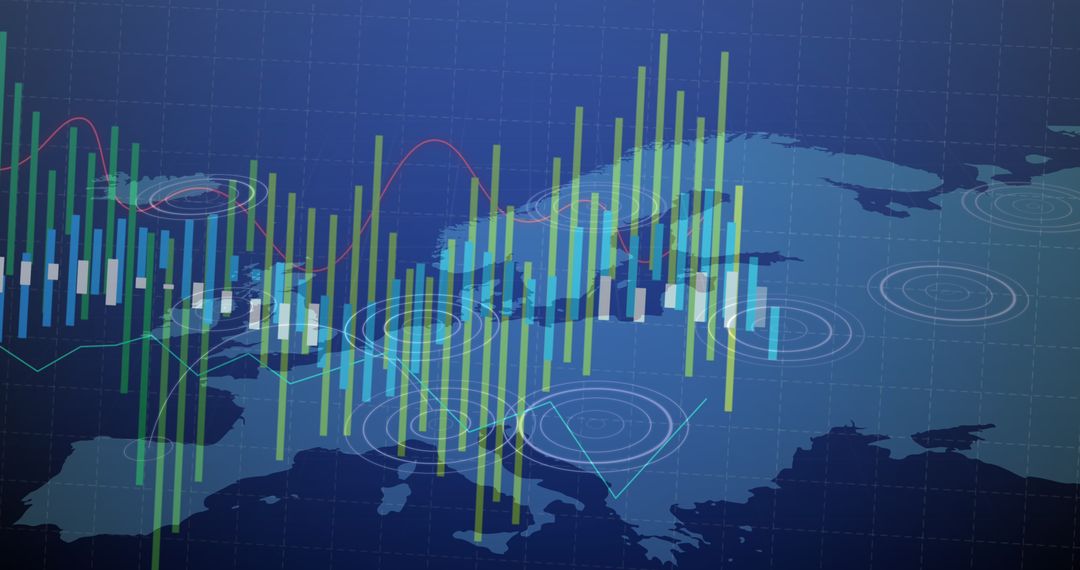
- Pulsing Global Candlestick Market Chart on Neon 3D Grid with White Globe
Pulsing Global Candlestick Market Chart on Neon 3D Grid with White Globe Image

High-resolution graphic showing neon candlestick chart over dotted world map and white globe, placed on perspective 3D grid. Suited for finance and technology projects including website headers, presentation slides, investor pitch decks, trading platform UI mockups, social media posts, and marketing campaigns. Helping convey global market activity, data-driven analysis, volatility, and investment insights. Allowing easy customization of colors, overlays, and text for brand use, editorial storytelling, or background for data dashboards.
Powered by  - Get 15% off with code: PIKWIZARD15


0
downloads
downloads
Tags:
More
Credit Photo
If you would like to credit the Photo, here are some ways you can do so
Text Link
photo Link
<span class="text-link">
<span>
<a target="_blank" href=https://pikwizard.com/photo/pulsing-global-candlestick-market-chart-on-neon-3d-grid-with-white-globe/33434b402c8dab3f2a9b55b0715509a7/>PikWizard</a>
</span>
</span>
<span class="image-link">
<span
style="margin: 0 0 20px 0; display: inline-block; vertical-align: middle; width: 100%;"
>
<a
target="_blank"
href="https://pikwizard.com/photo/pulsing-global-candlestick-market-chart-on-neon-3d-grid-with-white-globe/33434b402c8dab3f2a9b55b0715509a7/"
style="text-decoration: none; font-size: 10px; margin: 0;"
>
<img src="https://pikwizard.com/pw/medium/33434b402c8dab3f2a9b55b0715509a7.jpg" style="margin: 0; width: 100%;" alt="" />
<p style="font-size: 12px; margin: 0;">PikWizard</p>
</a>
</span>
</span>
Free (free of charge)
Free for personal and commercial use.
Author: Creative Art
Similar Free Stock Images

Premium


Premium


Premium


Premium


Premium


Premium


Premium


Premium


Premium


Premium


Premium


Premium


Premium


Premium


Premium


Premium


Premium


Premium


Premium


Premium


Premium


Premium


Premium


Premium