
- Home >
- Stock Photos >
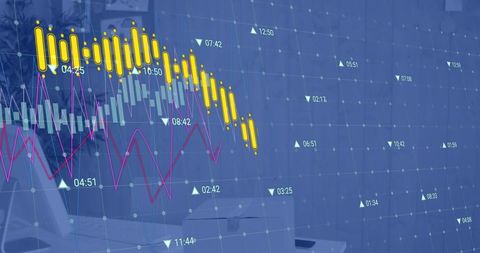
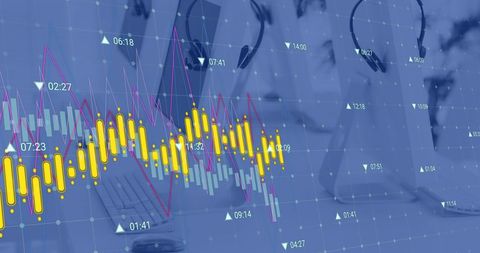
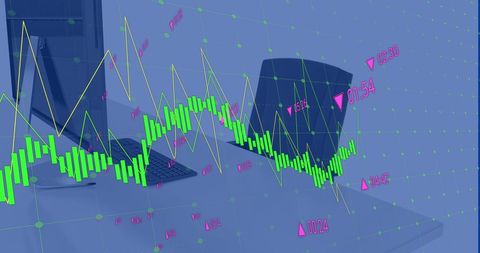
- Quantitative Data Analysis Displayed in Office Workspace
Quantitative Data Analysis Displayed in Office Workspace Image

Illustrates quantitative data analysis with digital graphs overlaid on an office workstation. Useful for articles or posts about finance trends, business analysis, or investment strategies. The visual blend of technology on a desk, accompanied by dynamic data displays, is ideal for promoting software related to financial analysis or depicting modern offices in tech-driven companies.
Powered by 


downloads
Tags:
More
Credit Photo
If you would like to credit the Photo, here are some ways you can do so
Text Link
photo Link
<span class="text-link">
<span>
<a target="_blank" href=https://pikwizard.com/photo/quantitative-data-analysis-displayed-in-office-workspace/b547d322ead7e485c8fd231f4df09064/>PikWizard</a>
</span>
</span>
<span class="image-link">
<span
style="margin: 0 0 20px 0; display: inline-block; vertical-align: middle; width: 100%;"
>
<a
target="_blank"
href="https://pikwizard.com/photo/quantitative-data-analysis-displayed-in-office-workspace/b547d322ead7e485c8fd231f4df09064/"
style="text-decoration: none; font-size: 10px; margin: 0;"
>
<img src="https://pikwizard.com/pw/medium/b547d322ead7e485c8fd231f4df09064.jpg" style="margin: 0; width: 100%;" alt="" />
<p style="font-size: 12px; margin: 0;">PikWizard</p>
</a>
</span>
</span>
Free (free of charge)
Free for personal and commercial use.
Author: Awesome Content
Similar Free Stock Images

Premium


Premium


Premium


Premium


Premium


Premium


Premium


Premium

Premium

Premium


Premium


Premium


Premium

Premium


Premium

Premium


Premium

Premium


Premium


Premium


Premium


Premium

Premium

Premium


Premium


Explore More Free Stock Images