- Home >
- Stock Photos >
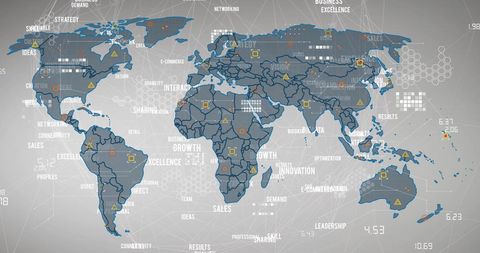
- Radial chart visualization for global data analytics
Radial chart visualization for global data analytics Image

A dynamic digital analytics dashboard featuring a radial bar chart over a stylized world map highlights key aspects of global business, finance, and technology. Ideal for illustrating international financial markets, cross-border data operations, and innovative tech platforms, it emphasizes interconnected business ecosystems, advanced data intelligence, and automated error management in complex systems.

downloads
Tags:
More
Credit Photo
If you would like to credit the Photo, here are some ways you can do so
Text Link
photo Link
<span class="text-link">
<span>
<a target="_blank" href=https://pikwizard.com/photo/radial-chart-visualization-for-global-data-analytics/b6a29a0c1e6d89696219c75b7ccb9961/>PikWizard</a>
</span>
</span>
<span class="image-link">
<span
style="margin: 0 0 20px 0; display: inline-block; vertical-align: middle; width: 100%;"
>
<a
target="_blank"
href="https://pikwizard.com/photo/radial-chart-visualization-for-global-data-analytics/b6a29a0c1e6d89696219c75b7ccb9961/"
style="text-decoration: none; font-size: 10px; margin: 0;"
>
<img src="https://pikwizard.com/pw/medium/b6a29a0c1e6d89696219c75b7ccb9961.jpg" style="margin: 0; width: 100%;" alt="" />
<p style="font-size: 12px; margin: 0;">PikWizard</p>
</a>
</span>
</span>
Free (free of charge)
Free for personal and commercial use.
Author: Creative Art