
- Home >
- Stock Photos >
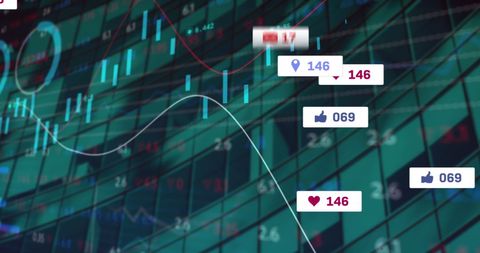
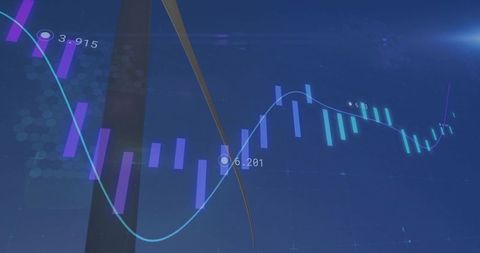
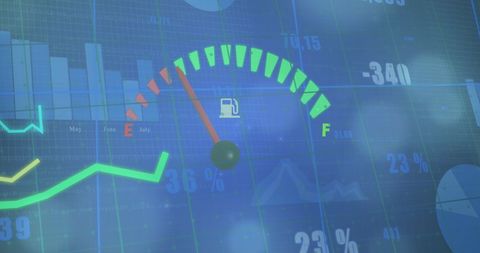
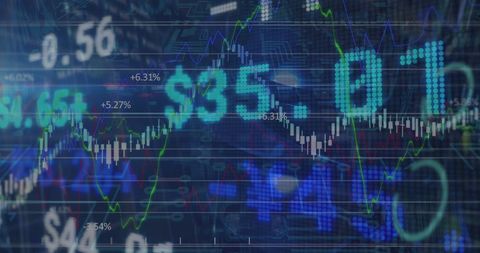
- Real-Time Digital Financial Data Analysis with Graphs
Real-Time Digital Financial Data Analysis with Graphs Image

Vivid depiction of real-time financial data analysis showing fluctuating numbers and graphs. Ideal for use in representing markets, economic studies, financial services, digital trading platforms, and educational materials on finance and global economics.
Powered by 


downloads
Tags:
More
Credit Photo
If you would like to credit the Photo, here are some ways you can do so
Text Link
photo Link
<span class="text-link">
<span>
<a target="_blank" href=https://pikwizard.com/photo/real-time-digital-financial-data-analysis-with-graphs/802cb682893c0fd7ddcc1feab3bea8e8/>PikWizard</a>
</span>
</span>
<span class="image-link">
<span
style="margin: 0 0 20px 0; display: inline-block; vertical-align: middle; width: 100%;"
>
<a
target="_blank"
href="https://pikwizard.com/photo/real-time-digital-financial-data-analysis-with-graphs/802cb682893c0fd7ddcc1feab3bea8e8/"
style="text-decoration: none; font-size: 10px; margin: 0;"
>
<img src="https://pikwizard.com/pw/medium/802cb682893c0fd7ddcc1feab3bea8e8.jpg" style="margin: 0; width: 100%;" alt="" />
<p style="font-size: 12px; margin: 0;">PikWizard</p>
</a>
</span>
</span>
Free (free of charge)
Free for personal and commercial use.
Author: Authentic Images
Similar Free Stock Images
Premium


Premium


Premium

Premium


Premium


Premium


Premium


Premium


Premium


Premium

Premium


Premium


Premium

Premium
Premium


Premium


Premium

Premium


Premium


Premium

Premium


Premium


Premium


Premium


Premium

Explore More Free Stock Images