1. Home > 
  2. Stock Photos > 
  3. Real-Time Financial Data Analysis with Graphs and Charts

Real-Time Financial Data Analysis with Graphs and Charts Image

Real-Time Financial Data Analysis with Graphs and Charts

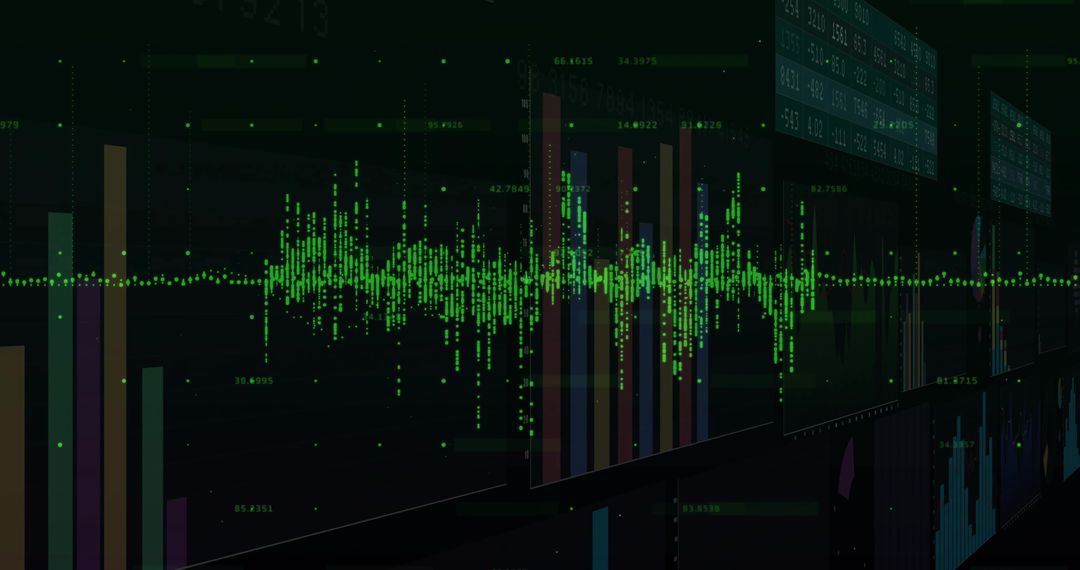
This visual illustrates real-time financial data analysis and processing through digital charts and graphs. It is ideal for presentations or articles related to finance, stock market analysis, data analytics, and business performance tracking. The futuristic theme is perfect for any content focusing on technological advancements in finance.

Powered by Adobe logo
ESG, Environment and Investment Green plants growing in front of financial graphs and charts. - Powered by AdobeA professional analyzing financial data using a digital tablet with dynamic charts and graphs. - Powered by AdobeBusiness report showing charts and graphs on a clipboard for data analysis on transparent background - Powered by AdobeBusiness financial chart with moving up arrow graph.Financial data charts with glowing stock market graphs.Stock market investment data and analysis finance graph.  - Powered by AdobeDigital forex and stock market chart with upward arrows and glowing data on dark screen background showing financial growth trends. 3D Rendering - Powered by Adobe

Credit Photo

If you would like to credit the Photo, here are some ways you can do so

Free (free of charge)

Free for personal and commercial use.

Author: Creative Art

Similar Free Stock Images

Abstract Digital Graphs Showing Financial Data Analysis
Premium
Business professionals collaborating and analyzing financial data on a laptop with charts and graphs during a meeting
Abstract Digital Data Network with Graphs and Symbols
Financial Data Graph Rendering Global Market Trends
Dynamic Financial Graph Visualizing Market Trends
Data Analytics and Financial Growth Indicators
Premium
Magnifying glass over financial charts and graphs showing data analysis and growth
Dynamic Stock Market Graphs and Financial Data
Futuristic Financial Data Visualization on Digital Interface
Digital Financial Data Graph Showcasing Market Trends
Financial Data Analysis with Declining Trends
Premium
Person using tablet displaying holographic financial charts and graphs financial data analytics
Dynamic Forex Trading Graphs with Increasing Numbers
Abstract Data Visualization with Dynamic Charts and Graphs
Dynamic Financial Data Visualization on Digital Grid Background
Dynamic Green Line Graph Depicting Financial Data
Premium
Medical stethoscope resting on financial charts illustrating healthcare data analysis and industry statistics in a business context.
Digital Data and Financial Charts on White Background
Dynamic Financial Graphs Overlaying Modern Cityscape
Green Line Graph with Data Points on Grid Background
Global Financial Data Processing with Abstract Graphs
Premium
Data analysis and financial charts on futuristic screen for business growth
Digital Sound Wave with Frequency Bars on Dark Blue Background
Abstract Representation of Financial Data Processing
Dynamic Financial Data Chart Showing Trend Analysis
Digital Stock Market Graph Red Trendline on Green Background
Premium
Ai generated image of laptop displaying financial data analysis charts and graphs isolated on transparent background
Candlestick Chart Visualization with Indicators and Growth Highlight
Futuristic Data Dashboard with Graph and Code Overlay
Interactive Digital Infographic with Callouts and Graph Elements
Visualizing market volatility on navy gradient with magenta and blue trend lines, copy space
Dynamic Financial Data Display in Digital Space
Financial Data Analysis with Dynamic Graph on Blue Background
Premium
Laptop screen displaying financial charts
Data Recovery Progress Display on Digital Interface
Rising Digital Graph and Data Visualizations on Black Background
Digital Finance: Modern Stock Market Analysis Display
Abstract Financial Graph with Rising Waves on Red Gradient
Premium
Person holding a smartphone displaying a financial dashboard with charts and graphs in a modern office setting
Dynamic Financial Growth Digital Chart Display
Analyzing Stock Market Trends with Dynamic Graphs and Data
Data Analytics Graphs on Digital Interface Background
Dynamic Business Data and Cityscape Visualization
Premium
Person drawing financial graphs on iPad with blue data in modern office.
Rising Graph Line on Digital Green Grid Background
Abstract Digital Charts with Social Media Metrics Rising
Digital Graph with Rising and Falling Lines on Grid Background
Financial Data Analysis Vibrant Graphs on Blue Background
Premium
Business, documents and woman in office, laptop and online reading with charts for tax report. Person, employee and accountant in workplace, PC and risk management with results for revenue or graphs
Dynamic Financial Graphs Overlaying Urban Skyline
Tech Growth Analysis with Dynamic Data Visualization
Financial Data Analysis with Futuristic Technology Interface
Dynamic Financial Data Overlaid on Grid Background
Premium
Professional woman analyzing data on a curved monitor. Charts and graphs display performance, strategy, and financial insights. Great for business  tech.
Financial Data with Molecular Background Concept
Financial Growth Stock Nikkei in Urban City Skyline
Abstract Data Visualization with Technological Grid Background
Futuristic Data Visualization Graph Vector Rising Trend
Premium
Magnifying glass focusing on candlestick chart, showcasing market analysis on a dark background, concept for financial review, investment strategy and business intelligence data analysis
Digital Finance Dashboard Showing Candlestick and Line Charts
Financial Dashboard with Line and Bar Graphs for Market Analysis
Neon Social Media Analytics Line Chart with Engagement Bubbles Showing Likes Comments
Graph Lines Portraying Financial Data Trends
Financial Data Overlay on Cityscape Visualizing Market Trends
Abstract Financial Graph On Black Background Representing Data Analysis
Premium
Business people analyzing financial charts and graphs at meeting
Digital Interface Showing Global Business Data Analytics
Fluctuating Digital Stock Market Data Chart
Dynamic Stock Market Graph Displaying Surging Growth
Data Trends and Analysis on 3D Digital Grid
Premium
Stacked financial reports with graphs and charts analysis business
Dynamic Stock Market Graphs Over Digital Interface
Abstract Digital Finance Chart Showing Fluctuating Graph Lines
Digital Stock Market Green Graph Against Dark Trading Board
Digital Data Visualization with Trend Lines and Percentage Changes
Premium
Analyzing financial growth charts for strategic business decisions and investment opportunities, envisioning success with data-driven insights and projections
Digital Simulated Global Financial Data and Graphs
Data Analysis Graphics on Digital Grid Background
Financial Data Analysis on Blue Digital Interface
NFT Financial Data Visualization with Digital Graph Overlay
Premium
Financial market data analysis with glowing 3D bar and line charts on dark background showing economic trends and growth concept visualization. 3D Rendering
Abstract Visualization of Financial Data and Circuit Board
Dynamic Financial Data on Digital Screen
Global Stock Market Data Visualization on Digital Map Background
Abstract Financial Data Processing and Analysis Interface
Premium
Laptop screen displaying financial data charts.
Digital Graphs and Data Visualization on Green Background
Dynamic Financial Data Chart with Rising Bars and Trend Lines
Advanced Digital Dashboard with Rising Bar and Line Charts
Financial Analysis Concept with Modern Chart Display
Premium
Diverse team analyzing complex financial data and charts on a large digital screen
Financial Growth Illustrated with Bar Charts and Upward Arrow
Multiseries Financial Market Chart Showing Rising Green Trend Candlesticks and Percent Labels
Dynamic Financial Data Graph on Blue Digital Background
Digital Financial Data Overlaying City Skyline at Dusk
Economic and Political Factors Influence Investment Trends
Futuristic Digital Data Analytics Interface Display
Premium
Analyzing business data charts and graphs for financial performance and marketing strategy
Digital Financial Data with Graph and Grid Patterns
Financial Graph Analysis on Green Grid Background
Dynamic Glowing Digital Graphs on 3D Grid Background
European Market Data Overlay with EU Flag and Financial Graphs
Premium
A businesswoman analyzes financial documents with charts and graphs at a desk, highlighting data trends with a pen in a bright, professional office setting.
Dynamic Financial Data Visualizations on Grid Interface
Digital Finance Chart Overlaying Globe Background
Colorful Data Visualization on Dark Background
Rising Financial Data Graph on Digital Grid Background
Premium
Man analyzing financial data on multiple screens
Global Networking Concept with 6G Technology Display
Abstract Graphs Over Modern Building at Night
Analyzing Financial Data on Digital World Map Background
Line Graph Illustrating Data Trend on Green Digital Background
Premium
Professional analyzes financial data on laptop and tablet, charts and graphs for strategic planning in a modern, bright office space for success
Financial Data Visualization on Dark Background
Abstract Financial Data Charts Reflecting Economic Trends
Abstract Digital Data Graph and Diagrams on Gray Background
Digital Data Processing with Graph and Grid Technology Interface
Premium
A magnifying glass examines detailed financial charts and graphs
Futuristic Digital Analytics Chart with Code Overlay
Futuristic Neon Green Data Visualization on Grid Background
Fluctuating Bar Chart on Futuristic Circuit Grid
Fluctuating Line Chart on Analytics Dashboard Interface
Premium
Business charts graphs analysis with calculator and magnifying glass
Pulsing Green Waveform on Holographic Analytics Dashboard, Futuristic Telemetry Visuals