
- Home >
- Stock Photos >
- Realtime Stock Ticker Display for Financial Data Analysis
Realtime Stock Ticker Display for Financial Data Analysis Image
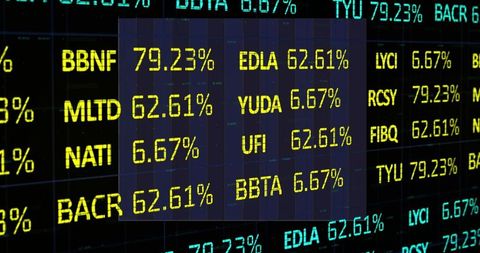
The image shows an electronic stock ticker display with various stock symbols and up-to-date percentage changes. It captures the digital representation of financial data essential for professionals in the investment sector. Suitable for use in articles or presentations about stocks, market analysis, or financial technology, emphasizing rapid change and data analysis in the financial markets.
Powered by  - Get 15% off with code: PIKWIZARD15


2
downloads
downloads
Tags:
More
Credit Photo
If you would like to credit the Photo, here are some ways you can do so
Text Link
photo Link
<span class="text-link">
<span>
<a target="_blank" href=https://pikwizard.com/photo/realtime-stock-ticker-display-for-financial-data-analysis/379ce8253dba5c1e643e2748669d9116/>PikWizard</a>
</span>
</span>
<span class="image-link">
<span
style="margin: 0 0 20px 0; display: inline-block; vertical-align: middle; width: 100%;"
>
<a
target="_blank"
href="https://pikwizard.com/photo/realtime-stock-ticker-display-for-financial-data-analysis/379ce8253dba5c1e643e2748669d9116/"
style="text-decoration: none; font-size: 10px; margin: 0;"
>
<img src="https://pikwizard.com/pw/medium/379ce8253dba5c1e643e2748669d9116.jpg" style="margin: 0; width: 100%;" alt="" />
<p style="font-size: 12px; margin: 0;">PikWizard</p>
</a>
</span>
</span>
Free (free of charge)
Free for personal and commercial use.
Author: Awesome Content