1. Home > 
  2. Stock Photos > 
  3. Realtime Trading Dashboard Showing Green Candlestick Chart with Technical Indicators and Volume

Realtime Trading Dashboard Showing Green Candlestick Chart with Technical Indicators and Volume Image

Realtime Trading Dashboard Showing Green Candlestick Chart with Technical Indicators and Volume

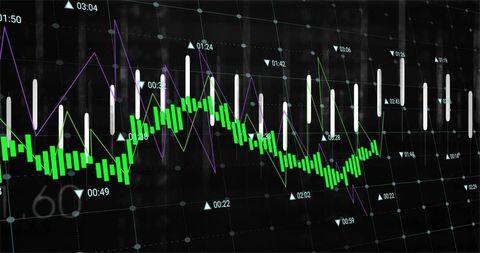
Showing dark trading dashboard with green candlestick bars, white candle markers, purple and green trend lines and dotted grid overlay. Displaying timestamps and triangular data markers for highlighting intraday movement and volatility. Working well for website hero banners, blog headers, social media posts, fintech product pages, investor reports and presentations. Helping illustrate technical analysis articles, market commentary, trading strategy guides, platform UI concepts, promotional materials for brokers and exchanges. Merging with bold typography and overlay text while leaving space for logos and call-to-action elements. Horizontal orientation suiting desktop banners; tight crop emphasizing candlesticks suiting thumbnails and social cards.

Powered by Shutterstock logo - Get 15% off with code: PIKWIZARD15
abstract Financial chart with moving up growing stock market graph in blue light color background - Powered by Shutterstock - Get 15% off with code: PIKWIZARD15Technical price graph and indicator, red and green candlestick chart on blue theme screen, market volatility, up and down trend. Stock trading, crypto currency background. - Powered by Shutterstock - Get 15% off with code: PIKWIZARD15Stock market or forex trading graph and candlestick chart suitable for financial investment concept. Economy trends background for business idea and all art work design. Abstract finance background - Powered by Shutterstock - Get 15% off with code: PIKWIZARD15Abstract glowing big data forex candlestick chart on blurry city backdrop. Trade, technology, investment and analysis concept. Double exposure - Powered by Shutterstock - Get 15% off with code: PIKWIZARD15Bangkok night cityscape and forex stock market hologram, candlesticks dynamics and statistics, bar chart with numbers. Concept of money investment, trading and profit - Powered by Shutterstock - Get 15% off with code: PIKWIZARD15

Credit Photo

If you would like to credit the Photo, here are some ways you can do so

Free (free of charge)

Free for personal and commercial use.

Author: People Creations

Similar Free Stock Images

Graph Lines Portraying Financial Data Trends
Premium
Stock market financial investment and trading graph interface showing ticker price evolution with candlestick chart and moving average curves. Increasing profit. Forex. Person touching virtual screen.
Digital Graph Display with Dynamic Flux on Purple Background
Digital Interface Showing Global Business Data Analytics
Digital Financial Data on Server with Stock Market Graph
Digital Financial Data with Graph and Grid Patterns
Premium
Closeup of stock market volatility of crypto trading with technical price graph and indicator, red and green candlesticks on blue display background
Dynamic Stagflation Concept Displaying Economic Burdens
Financial Graphs Overlaying Shopping Bag Representation Economy
Rising Financial Data Graph on Digital Grid Background
Digital Financial Data Analytics and Trend Graphs
Premium
Stock market or forex trading graph and candlestick chart suitable for financial investment concept. Economy trends background for business idea and all art work design. Abstract finance background.
Financial Data Analysis Vibrant Graphs on Blue Background
NFT Financial Data Visualization with Digital Graph Overlay
Dynamic Financial Graphs Overlaying Modern Cityscape
Line Graph Illustrating Data Trend on Green Digital Background
Premium
Growth property price and real estate concept with digital graphic stats data and raising up diagram on city skyscraper tops background bottom view, double exposure
Digital Sound Wave with Frequency Bars on Dark Blue Background
Financial Data with Molecular Background Concept
Financial Growth Stock Nikkei in Urban City Skyline
Dynamic Data Analysis on Digital Graph, Technology Background
Premium
Earth sphere hologram with candlesticks and growing lines. Panoramic Bangkok cityscape at night. Concept of forex and investment, online trading and global market
Futuristic Data Visualization Graph Vector Rising Trend
Financial Analysis Concept with Modern Chart Display
Futuristic Candlestick Chart with Blueprint Grid
Futuristic 3D Finance Dashboard with Neon Waveform and Candlesticks
Premium
Volatile U.S. stock market candlestick chart with a faded American flag in the background — symbolizing economic uncertainty, financial risk, and fluctuating market conditions in the United States.
Futuristic Data Visualization with Green Line Graph and Analytics Interface
Futuristic Green Line Graph on Digital Display Panel
Tracking rising market trend with bold green line on futuristic trading dashboard display
Futuristic data waveform tracking green trend line across blue helix analytics grid
Financial Data Overlay on Cityscape Visualizing Market Trends
Abstract Financial Graph On Black Background Representing Data Analysis
Premium
Stockmarket online trading chart candlestick on crypto currency platform. Stock exchange financial market price candles graph data pattern analysis concept. Computer screen closeup background
Digital Interface with Global Financial Graphs Background
Data Analytics and Financial Growth Indicators
Abstract Financial Graph with Rising Waves on Red Gradient
Dynamic Stock Market Graphs and Financial Data
Premium
Analysis finance graph and market chart investment.Trade technology, and investment analysis.Big data chart on city backdrop.Business development, financial plan and strategy.
Digital Data Visualization with Trend Lines and Percentage Changes
Data Visualization with Rising Red Arrow and Floating Numbers
Data Visualization of Financial Market with Dots and Lines
Data Visualization on Security Shield Interface for Cyber Security
Premium
Stock market or forex trading graph and candlestick chart suitable for financial investment concept. Economy trends background for business idea and all art work design. Abstract finance background.
Dynamic Financial Chart with Upward Growth Arrow
Dynamic Financial Graphs Overlaying Urban Skyline
Tech Growth Analysis with Dynamic Data Visualization
Dynamic Financial Data on Digital Screen
Premium
Investor Planning and strategy, Stock market, business people working with technical price graph and indicator, candlestick chart and stock trading tablet screen financial investment growth concept.
Dynamic Financial Data Chart Showing Trend Analysis
Digital Graphs and Data Visualization on Green Background
Futuristic Digital Graph Showing Data Trends on Analytic Interface
Digital Interface Displaying Financial Market Trends
Premium
Real estate market growth concept with digital screen with raising stock market candlestick on blue sky and tops of modern skyscrapers background. Double exposure
Futuristic Data Dashboard with Graph and Code Overlay
Digital Finance Dashboard Showing Candlestick and Line Charts
Futuristic Energy Tracking with Rocket Blueprint and Data Analytics
Financial Dashboard with Line and Bar Graphs for Market Analysis
Premium
The red crashing market volatility of crypto trading with technical graph and indicator, red candlesticks going down without resistance, market fear and downtrend. Cryptocurrency background concept.
Visualizing social media engagement with neon analytics chart and interaction callouts
Interactive Neon Line Chart Tracking Data Trends with Callouts and Circular Markers
Interactive Financial Dashboard Visualizing Bar Charts and Line Trends on Futuristic Grid
Digital Financial Data Overlaying City Skyline at Dusk
Financial Data Graph Rendering Global Market Trends
Dynamic Financial Graph in Virtual Red Grid Background
Premium
chart, graph, finance, stock, analysis, financial, digital, growth, investment, investor. measuring level bar via indicator and pie chart virtual, risky business risk management control and strategy.
Futuristic Data Processing Animation with Media Icons
Dynamic Stock Market Graph Displaying Surging Growth
Dynamic Data Graphs on Digital Interface Background
Data Trends and Analysis on 3D Digital Grid
Premium
Stock market graph trading analysis investment financial, stock exchange financial or forex graph stock market graph chart business crisis crash loss and grow up gain and profits win up trend
Digital Simulated Global Financial Data and Graphs
Dynamic Green Line Graph Depicting Financial Data
Data Analysis Graphics on Digital Grid Background
Financial Data Analysis on Blue Digital Interface
Premium
Closeup financial chart with uptrend line candlestick graph in stock market on monitor background
Cityscape with Digital Stock Market Graphs and Statistics
Global Financial Data Processing with Abstract Graphs
Real-Time Financial Data Analysis with Graphs and Charts
Abstract Digital Data Graph and Diagrams on Gray Background
Premium
Double exposure of abstract glowing big data forex candlestick chart on blurry backdrop. Trade, technology, investment and analysis concept.
Digital Stock Market Graph Red Trendline on Green Background
Futuristic Green Line Graph on Digital Grid Background
Dynamic Stock Market Chart with Grid and Trend Lines
Advanced Digital Dashboard with Rising Bar and Line Charts
Premium
stock market candlestick chart pattern design on blue background, business financial growth
Dynamic Financial Chart on Digital Dashboard
Fluctuating Line Chart on Analytics Dashboard Interface
Global Analytics with Futuristic Interface and Grid Overlay
Dynamic Green Data Chart on Futuristic Digital Interface Background
Premium
Serious business man trader analyst looking at computer monitor, investor broker analyzing indexes, financial chart trading online investment data on cryptocurrency stock market graph on pc screen.
Pulsing Neon Magenta Waveform Over Dark Data Grid with Holographic Charts
Neon Social Media Analytics Line Chart with Engagement Bubbles Showing Likes Comments
Abstract Digital Data Network with Graphs and Symbols
Futuristic Digital Data Analytics Interface Display
Dynamic Financial Graph Visualizing Market Trends
Abstract Financial Data Visualization in Server Room
Premium
Showing price labels and up or down triangle indicators on trading screen, with candlestick chart. Financial analysis, investment, market trends, digital dashboard, technical analysis, stock charts,
Financial Graph Analysis on Green Grid Background
Abstract Digital Graph and Code on Violet Background
Digital Finance Chart Overlaying Globe Background
Abstract Data Visualization with Dynamic Charts and Graphs
Premium
Financial stock market. Abstract financial chart with graph and stack of coins in Double exposure style background. Growing business graph with rising up trend
Digital Graph with Rising and Falling Lines on Grid Background
Financial Data Graphics Over World Map in Digital Style
Abstract Graphs Over Modern Building at Night
Analyzing Financial Data on Digital World Map Background
Premium
Stock market or forex trading graph and candlestick chart suitable for financial investment concept. Economy trends background for
Financial Data Analysis with Futuristic Technology Interface
Global Data Analytics Over World Map with Numeric Statistics
Abstract Representation of Financial Data Processing
Financial Stock Market Data Visualization with Declining Trends
Premium
Forex trade market and development concept with growing digital candlestick and indicators on sunny skyscrapers background. Double exposure
Futuristic Digital Analytics Chart with Code Overlay
Advanced Financial Charting with Zigzag Indicator and Trends
Complex Financial Data Graph with Multicolored Trends and Analytics
Modern Financial Analysis Display with Dynamic Bar and Line Graphs
Premium
Stock market or forex trading graph and candlestick chart suitable for financial investment concept. Economy trends background for business idea and all art work design. Abstract finance background.
Interactive Digital Analytics Dashboard for Real-Time Data Tracking
Financial Data Visualization with Colorful Graphs and Charts Representing Analytics
Financial Growth Illustrated with Bar Charts and Upward Arrow
3D Candlestick Chart on Neon Trading Dashboard Holographic Finance Data Visualization
Premium
Stock market or forex trading graph and candlestick chart suitable for financial investment concept. Economy trends background for business idea and all art work design
Multiseries Financial Market Chart Showing Rising Green Trend Candlesticks and Percent Labels