- Home >
- Stock Photos >
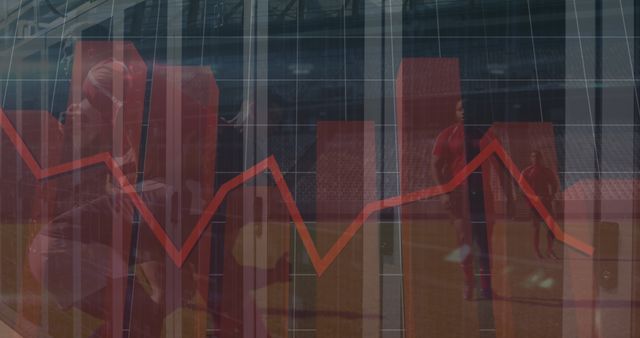
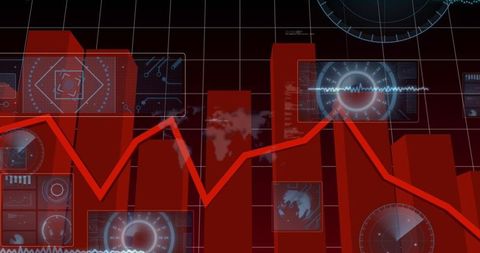
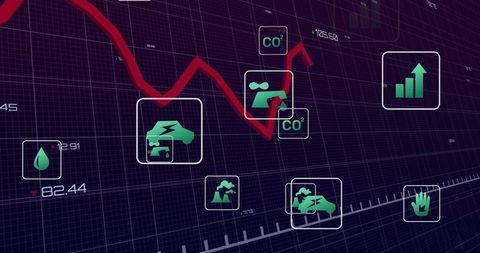
- Red 3D Bar Charts and Line Graph Overlapping in Office Environment
Red 3D Bar Charts and Line Graph Overlapping in Office Environment Image

The abstract composition of red 3D bar charts and a fluctuating line graph set against an office grid backdrop symbolizes dynamic data flows and business intelligence. This innovative representation, in connectivity with modern technology, captures concepts such as economic trends, corporate analytics, and performance measurement. Perfect for illustrating technical reports, showcasing insights in business presentations, or designing financial platforms, emphasizing the prowess of strategic analysis and decision-making grounded in solid data interpretation.
Powered by 


downloads
Tags:
More
Credit Photo
If you would like to credit the Photo, here are some ways you can do so
Text Link
photo Link
<span class="text-link">
<span>
<a target="_blank" href=https://pikwizard.com/photo/red-3d-bar-charts-and-line-graph-overlapping-in-office-environment/0e733b001a9c8de1b2c1330d4c27a594/>PikWizard</a>
</span>
</span>
<span class="image-link">
<span
style="margin: 0 0 20px 0; display: inline-block; vertical-align: middle; width: 100%;"
>
<a
target="_blank"
href="https://pikwizard.com/photo/red-3d-bar-charts-and-line-graph-overlapping-in-office-environment/0e733b001a9c8de1b2c1330d4c27a594/"
style="text-decoration: none; font-size: 10px; margin: 0;"
>
<img src="https://pikwizard.com/pw/medium/0e733b001a9c8de1b2c1330d4c27a594.jpg" style="margin: 0; width: 100%;" alt="" />
<p style="font-size: 12px; margin: 0;">PikWizard</p>
</a>
</span>
</span>
Free (free of charge)
Free for personal and commercial use.
Author: People Creations
Similar Free Stock Images
Loading...

Premium


Premium

Premium


Premium

Premium


Premium


Premium


Premium


Premium


Premium


Premium


Premium


Premium


Premium


Premium


Premium


Premium


Premium


Premium


Premium


Premium


Premium


Premium


Premium


Premium