
- Home >
- Stock Photos >
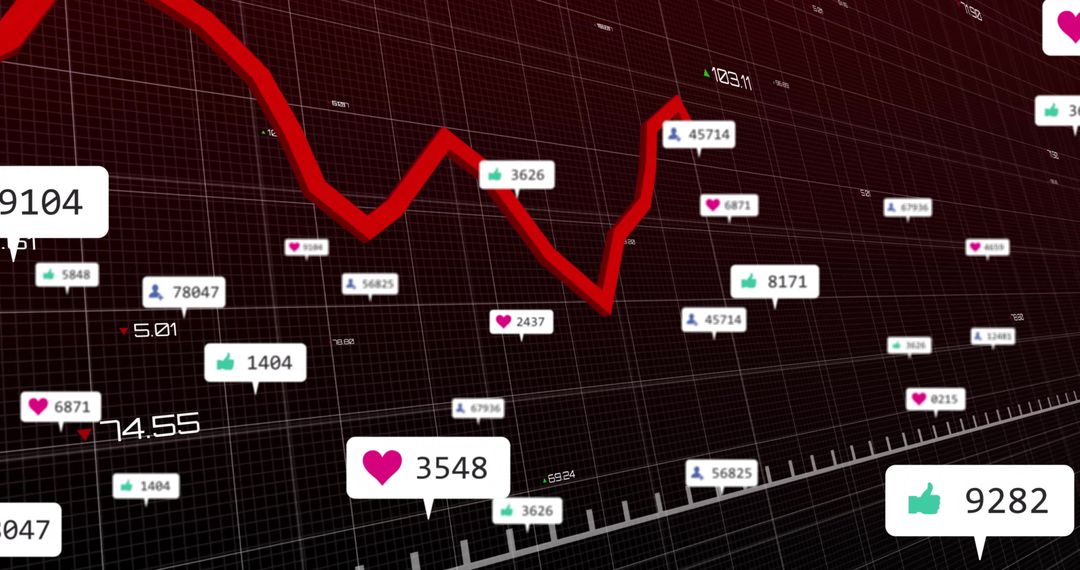
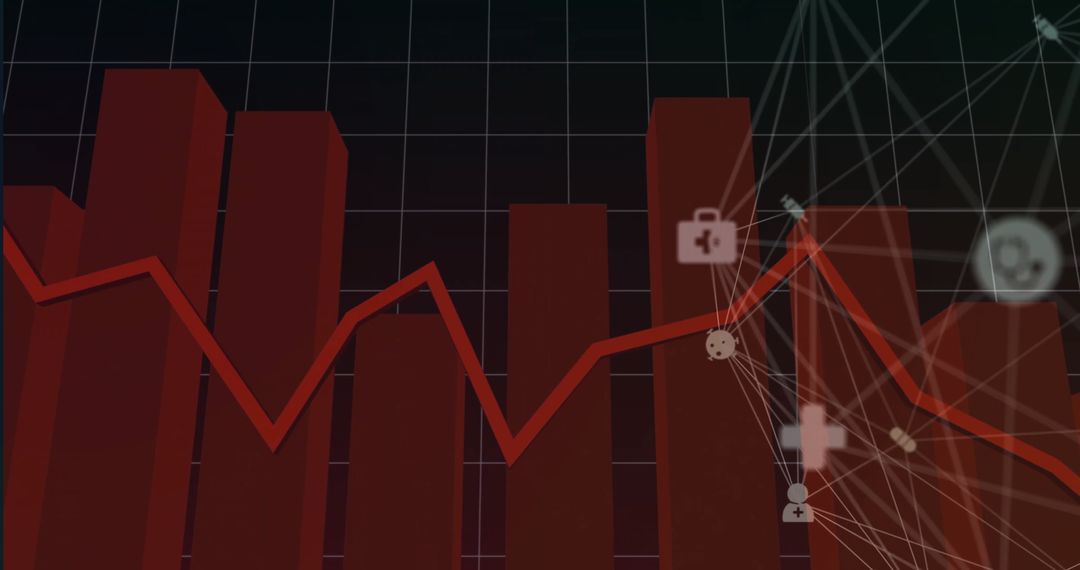
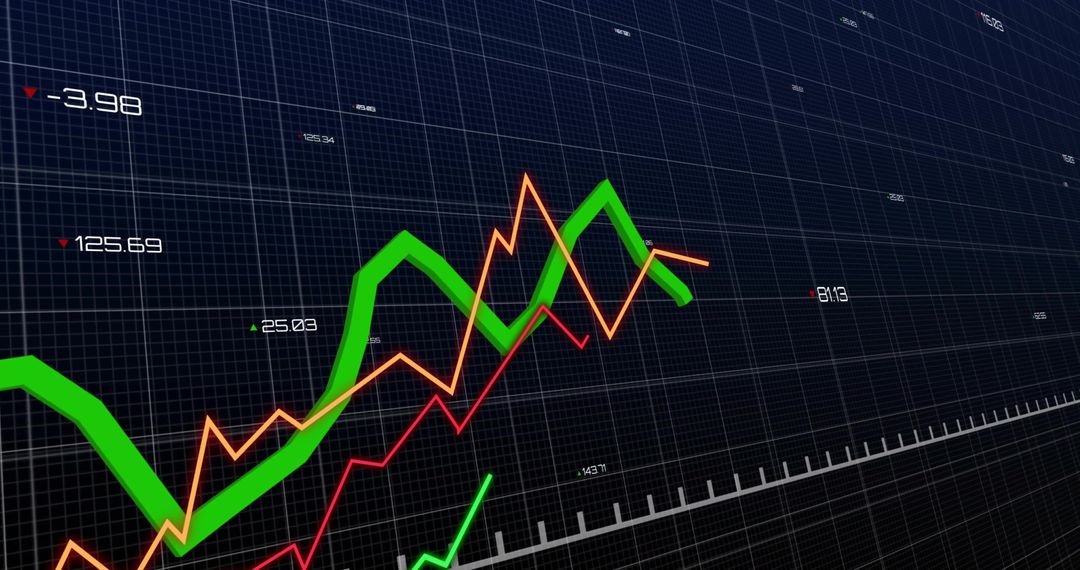
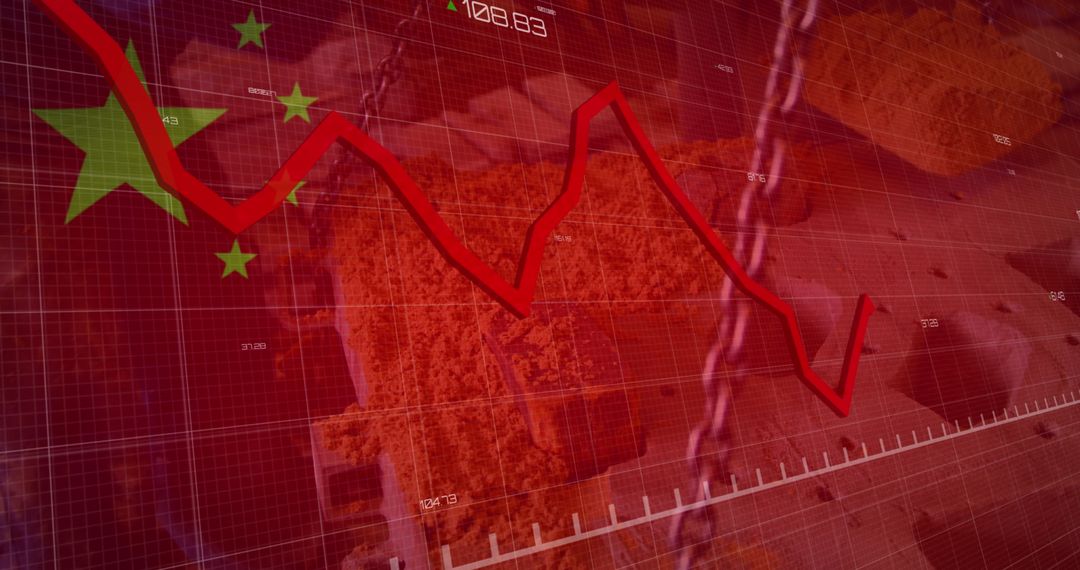
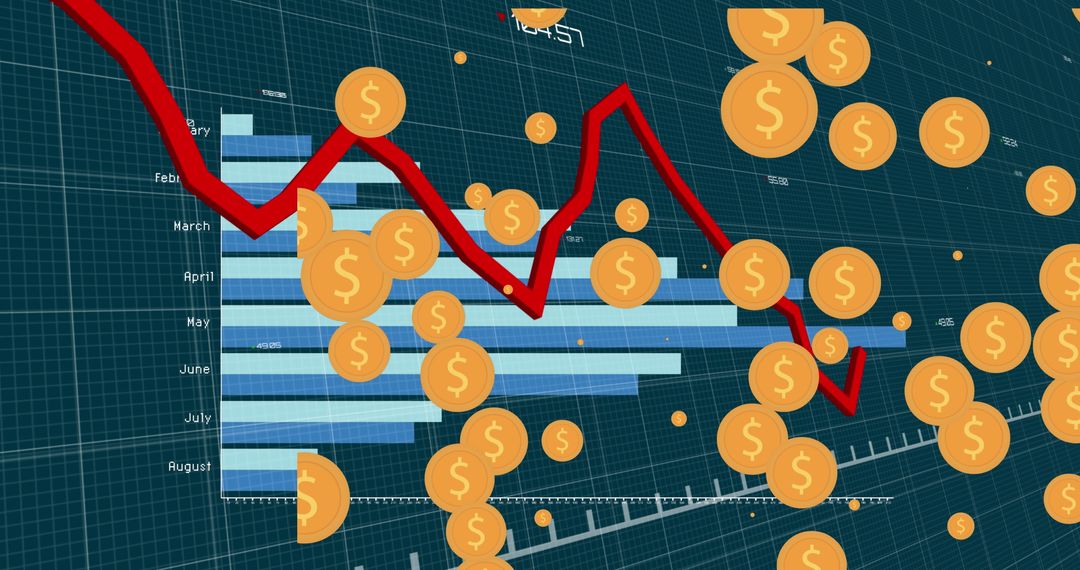
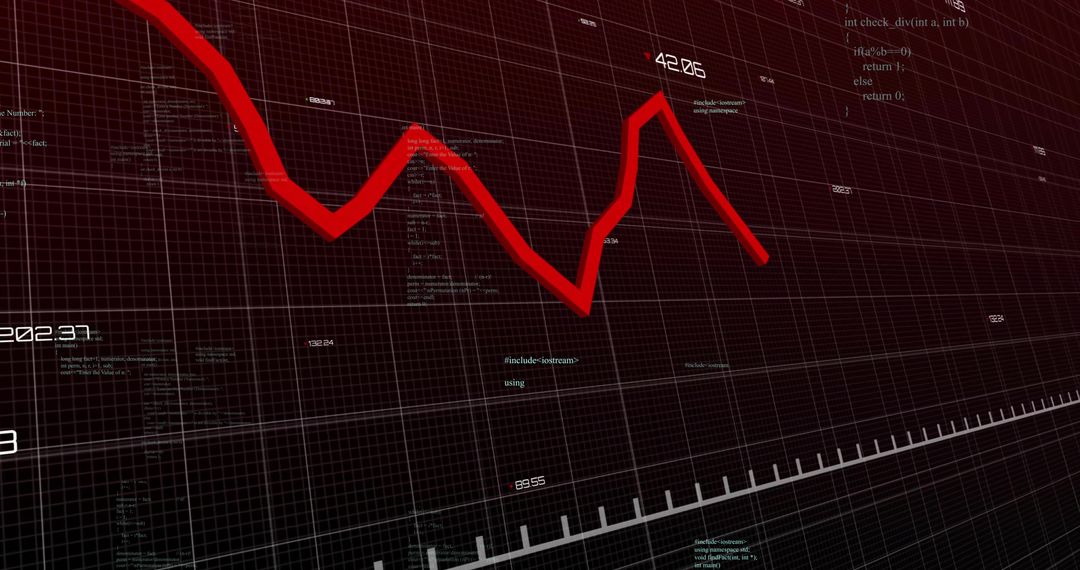
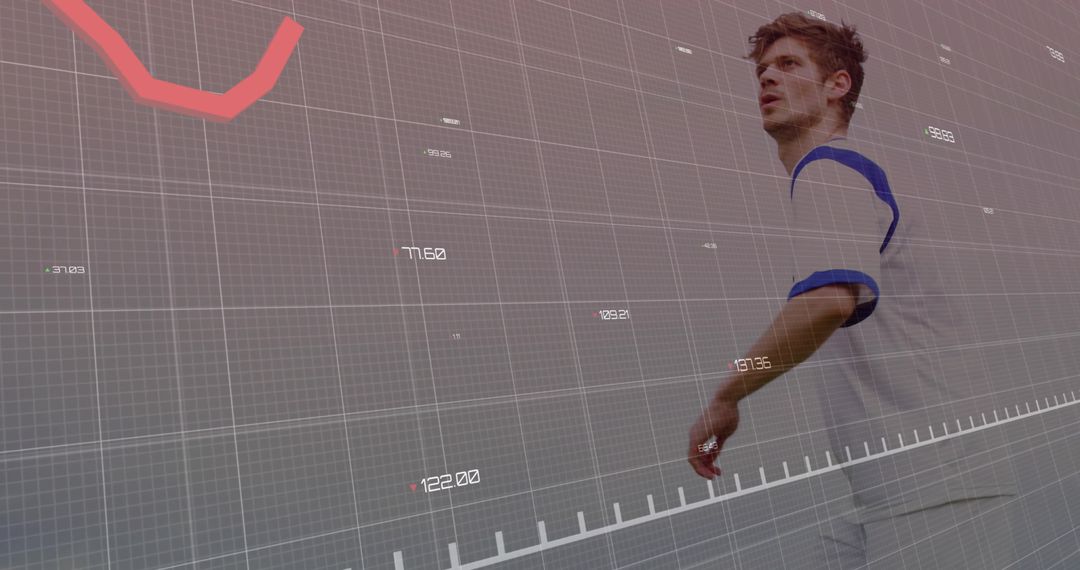
- Red and Gold Digital Financial Data Chart with Declining Trendline
Red and Gold Digital Financial Data Chart with Declining Trendline Image

Digital chart displaying a fluctuating financial trendline on a graph with golden stars. Suitable for illustrating concepts related to market analysis, investments, economic trends, and technological financial solutions. Ideal for use in presentations, financial reports, and analytical tools demonstrating the volatility in market trends and the role of technology in data visualization.
Powered by 


0
downloads
downloads
Tags:
More
Credit Photo
If you would like to credit the Photo, here are some ways you can do so
Text Link
photo Link
<span class="text-link">
<span>
<a target="_blank" href=https://pikwizard.com/photo/red-and-gold-digital-financial-data-chart-with-declining-trendline/1e64caf9e8c0601a3895a4f8949534ac/>PikWizard</a>
</span>
</span>
<span class="image-link">
<span
style="margin: 0 0 20px 0; display: inline-block; vertical-align: middle; width: 100%;"
>
<a
target="_blank"
href="https://pikwizard.com/photo/red-and-gold-digital-financial-data-chart-with-declining-trendline/1e64caf9e8c0601a3895a4f8949534ac/"
style="text-decoration: none; font-size: 10px; margin: 0;"
>
<img src="https://pikwizard.com/pw/medium/1e64caf9e8c0601a3895a4f8949534ac.jpg" style="margin: 0; width: 100%;" alt="" />
<p style="font-size: 12px; margin: 0;">PikWizard</p>
</a>
</span>
</span>
Free (free of charge)
Free for personal and commercial use.
Author: Creative Art
Similar Free Stock Images

Premium


Premium


Premium


Premium


Premium


Premium


Premium


Premium


Premium


Premium


Premium


Premium


Premium


Premium


Premium


Premium


Premium


Premium


Premium


Premium


Premium


Premium


Premium


Premium

