- Home >
- Stock Photos >
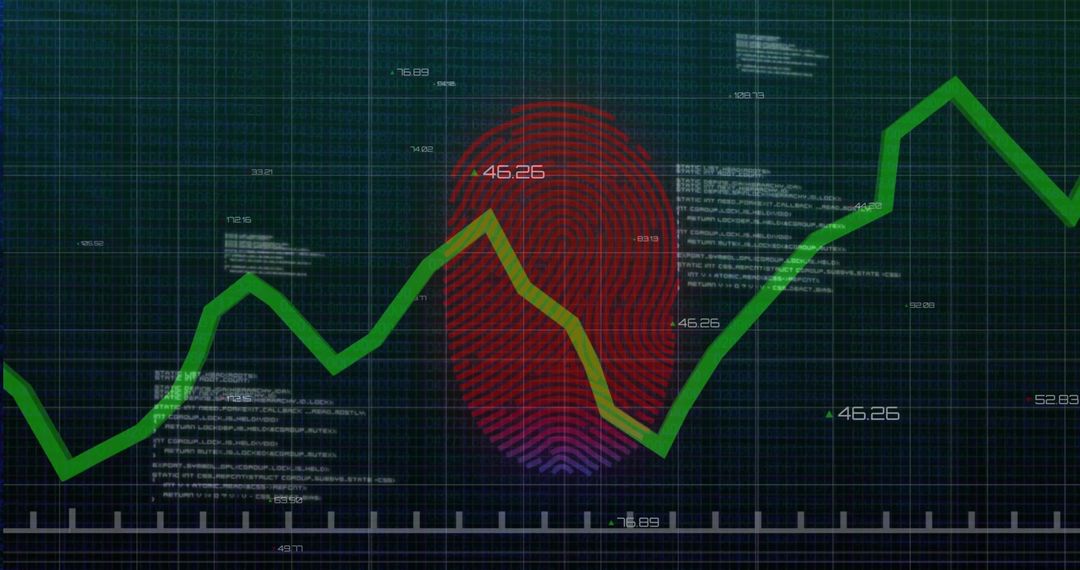
- Red Arrow with Binary Background Showing Market Decline
Red Arrow with Binary Background Showing Market Decline Image

Shows red arrow between binary code, emphasizing downtrend. Useful for financial presentations and technology themes. Ideal for illustrating decreasing markets or negative business trends in digital content.

0
downloads
downloads
Tags:
More
Credit Photo
If you would like to credit the Photo, here are some ways you can do so
Text Link
photo Link
<span class="text-link">
<span>
<a target="_blank" href=https://pikwizard.com/photo/red-arrow-with-binary-background-showing-market-decline/d2b587edab483d3d380398558a5bdd01/>PikWizard</a>
</span>
</span>
<span class="image-link">
<span
style="margin: 0 0 20px 0; display: inline-block; vertical-align: middle; width: 100%;"
>
<a
target="_blank"
href="https://pikwizard.com/photo/red-arrow-with-binary-background-showing-market-decline/d2b587edab483d3d380398558a5bdd01/"
style="text-decoration: none; font-size: 10px; margin: 0;"
>
<img src="https://pikwizard.com/pw/medium/d2b587edab483d3d380398558a5bdd01.jpg" style="margin: 0; width: 100%;" alt="" />
<p style="font-size: 12px; margin: 0;">PikWizard</p>
</a>
</span>
</span>
Free (free of charge)
Free for personal and commercial use.
Author: Awesome Content
Similar Free Stock Images