
- Home >
- Stock Photos >
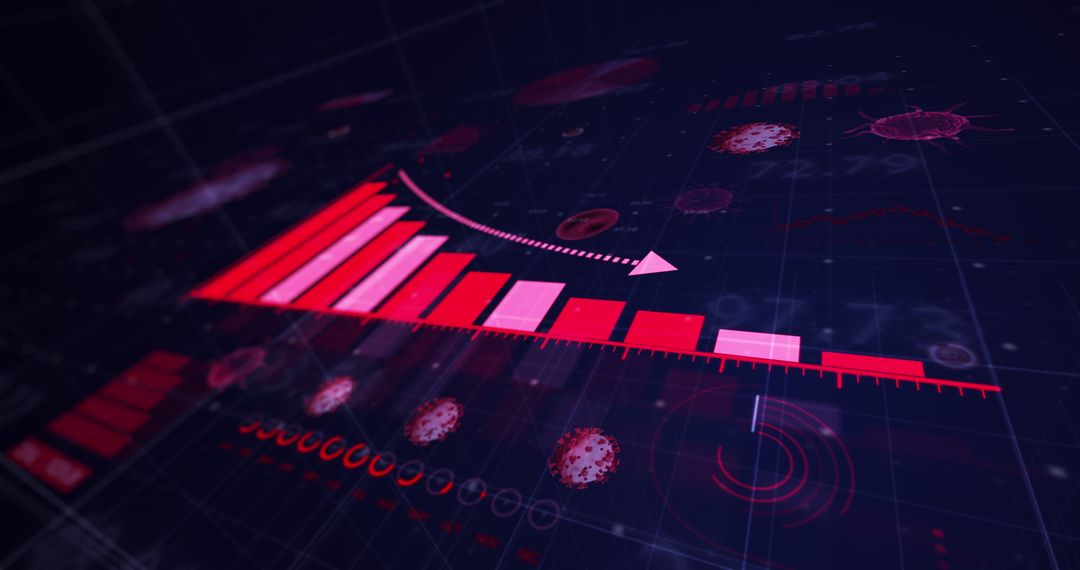
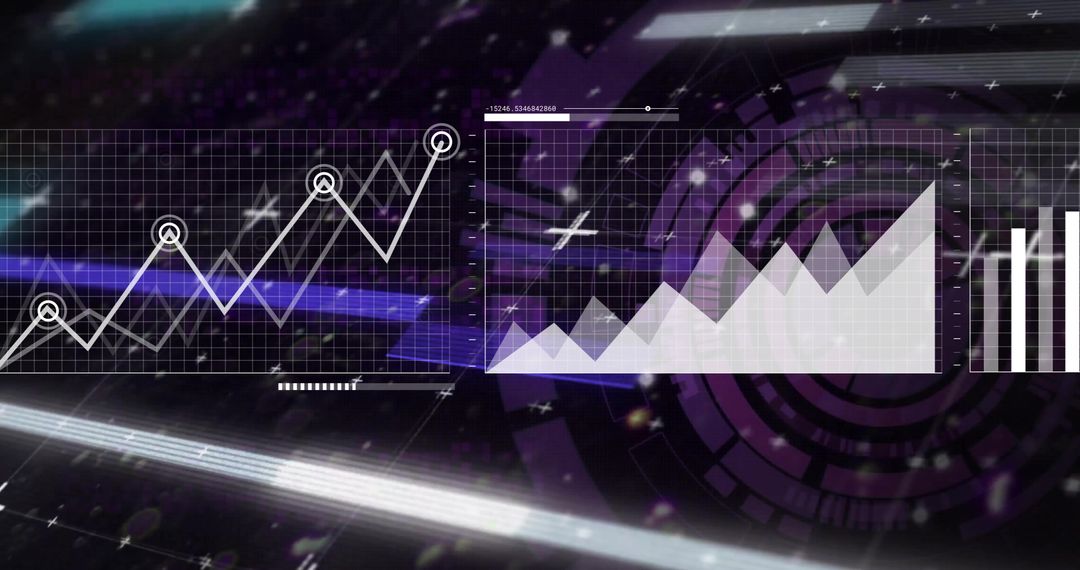
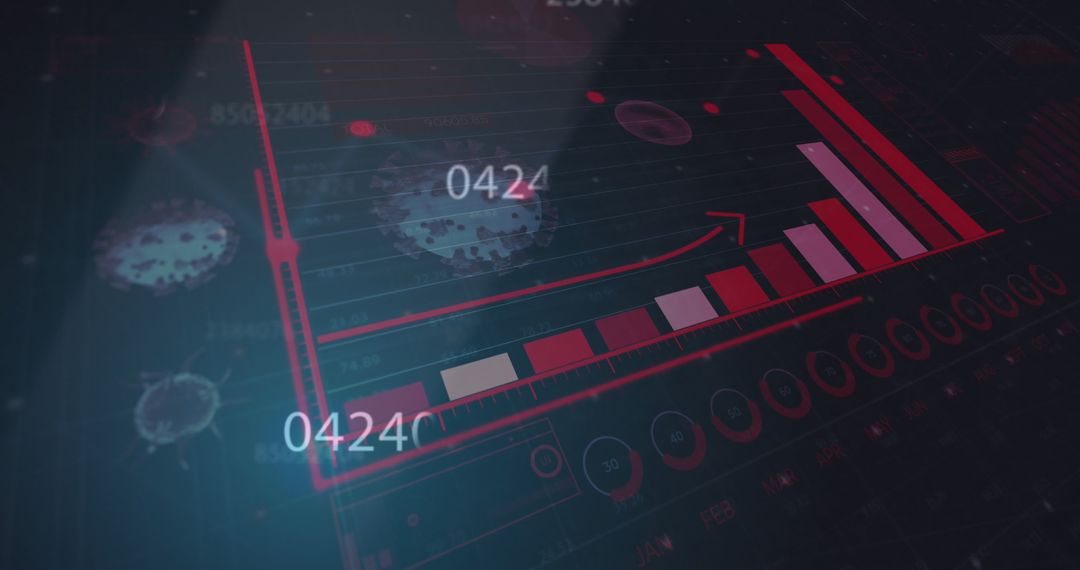
- Red Digital Analytics HUD Displaying Financial Charts, 2016 Bar Graph, Radar Interface
Red Digital Analytics HUD Displaying Financial Charts, 2016 Bar Graph, Radar Interface Image

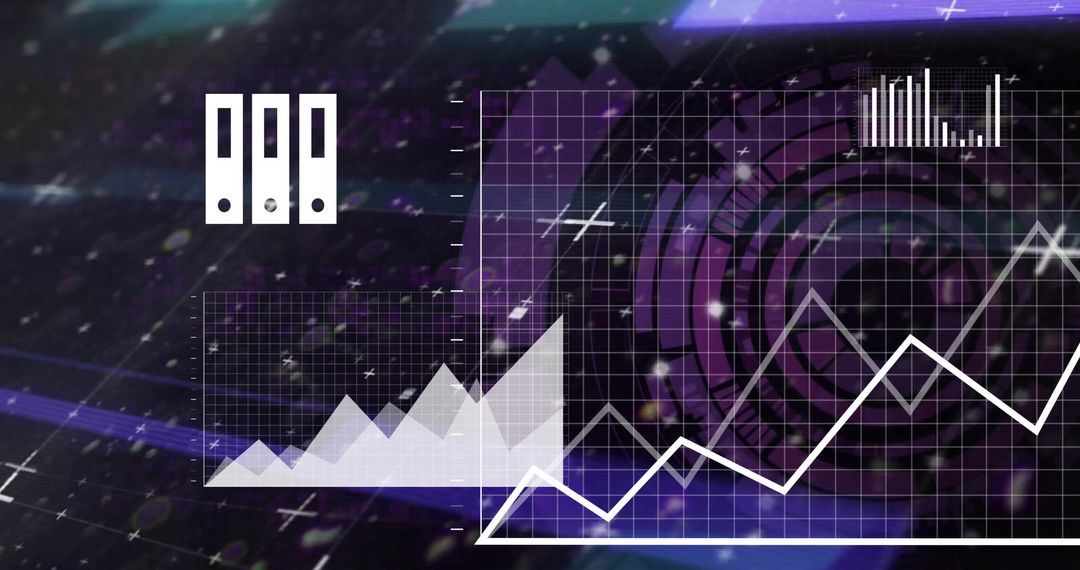
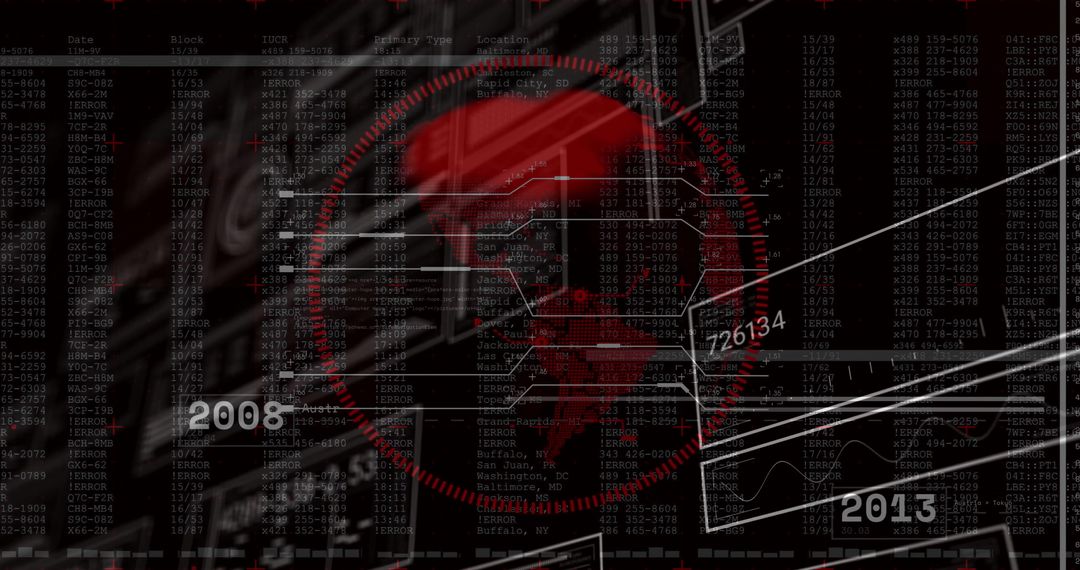
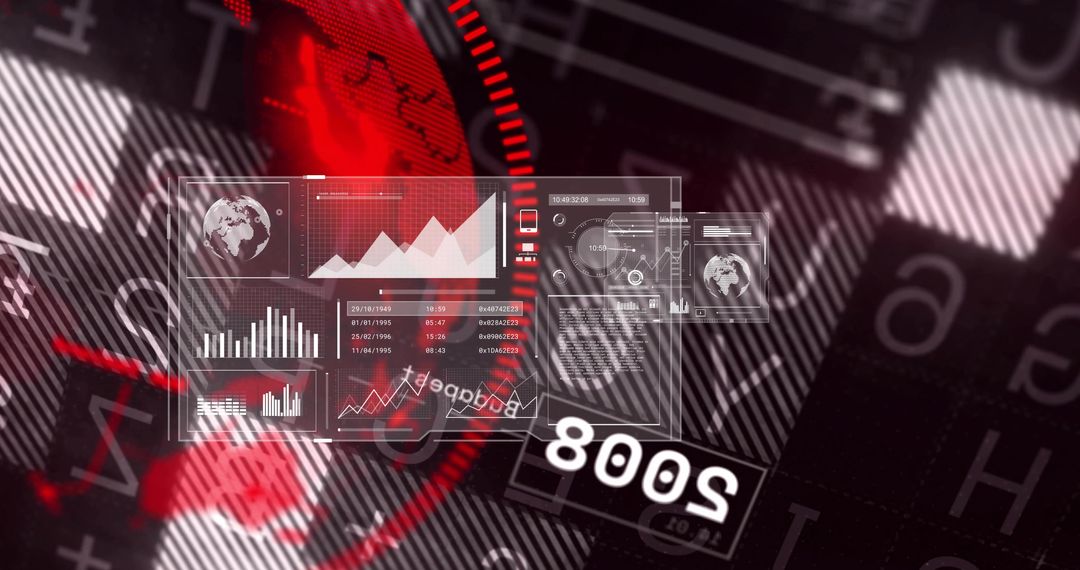
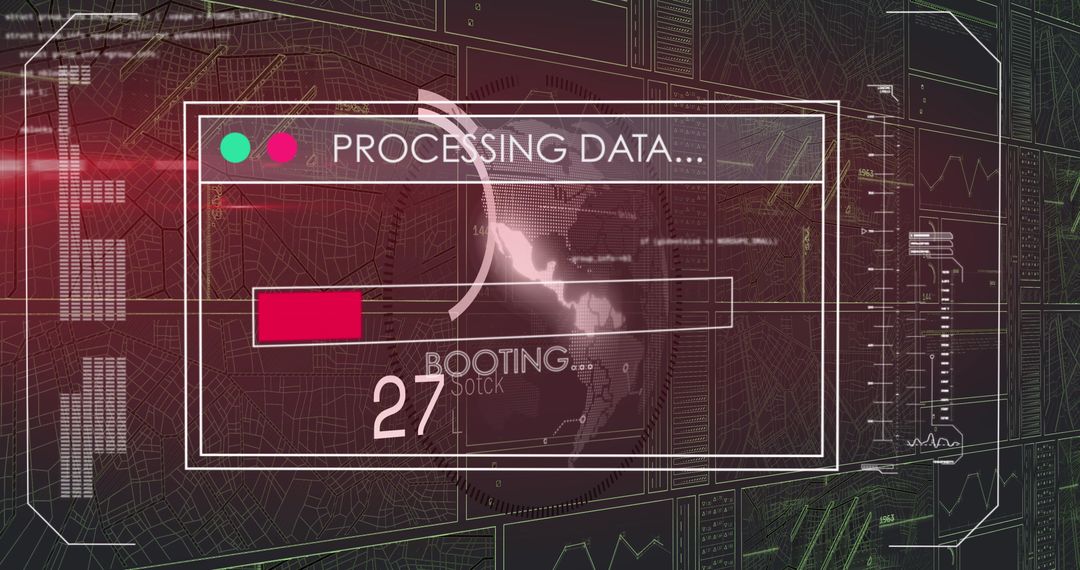
Displaying red-toned digital HUD with central area chart showing white peaks, overlaid 2016 bar graph, circular radar rings, numeric matrix and grid. Combining layered transparency, motion blur and light flare for dynamic futuristic aesthetic. Emphasizing analytics, financial performance and real-time data monitoring. Ideal for presenting technology website hero, enhancing fintech blog header, supporting corporate slide decks, enriching annual reports, illustrating investment analysis, strengthening investor presentations, complementing UI mockups and video backgrounds. Editable for color and overlay adjustments to match brand palette.
Powered by  - Get 15% off with code: PIKWIZARD15


0
downloads
downloads
Tags:
More
Credit Photo
If you would like to credit the Photo, here are some ways you can do so
Text Link
photo Link
<span class="text-link">
<span>
<a target="_blank" href=https://pikwizard.com/photo/red-digital-analytics-hud-displaying-financial-charts-2016-bar-graph-radar-interface/4eee49a0b2e2d633579064d7c9c4f38a/>PikWizard</a>
</span>
</span>
<span class="image-link">
<span
style="margin: 0 0 20px 0; display: inline-block; vertical-align: middle; width: 100%;"
>
<a
target="_blank"
href="https://pikwizard.com/photo/red-digital-analytics-hud-displaying-financial-charts-2016-bar-graph-radar-interface/4eee49a0b2e2d633579064d7c9c4f38a/"
style="text-decoration: none; font-size: 10px; margin: 0;"
>
<img src="https://pikwizard.com/pw/medium/4eee49a0b2e2d633579064d7c9c4f38a.jpg" style="margin: 0; width: 100%;" alt="" />
<p style="font-size: 12px; margin: 0;">PikWizard</p>
</a>
</span>
</span>
Free (free of charge)
Free for personal and commercial use.
Author: Authentic Images
Similar Free Stock Images
Premium


Premium


Premium


Premium


Premium


Premium


Premium


Premium


Premium


Premium


Premium


Premium


Premium


Premium


Premium


Premium


Premium


Premium


Premium


Premium


Premium


Premium


Premium


Premium

