- Home >
- Stock Photos >
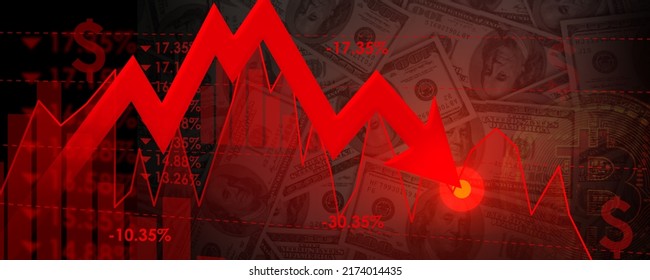
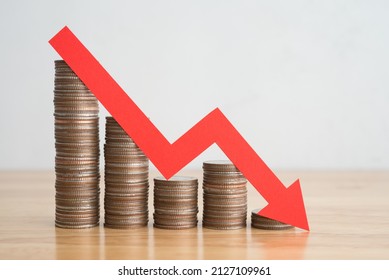
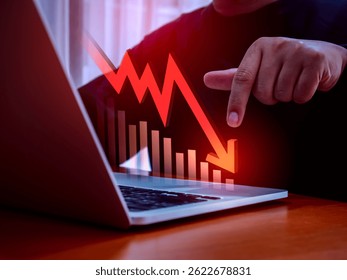
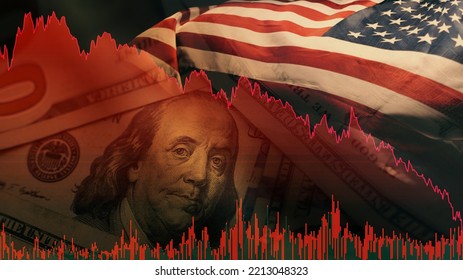
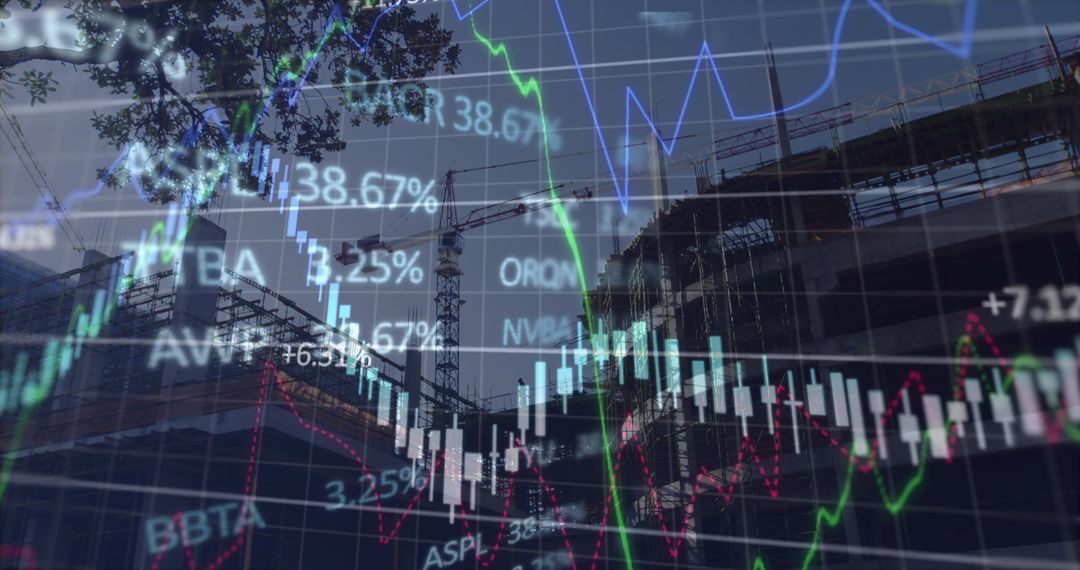
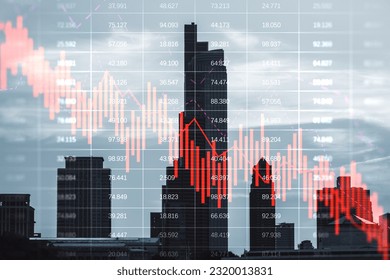
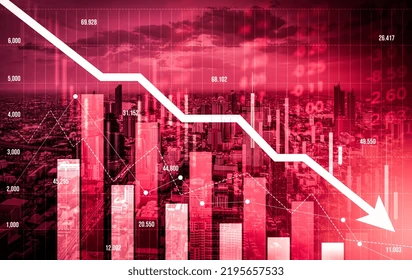
- Red Down Arrow Overlaying Financial Data Graphs for Market Prediction
Red Down Arrow Overlaying Financial Data Graphs for Market Prediction Image
Depicting the movement of stock prices, this image is ideal for illustrating concepts of market adjustments or economic downturns. It can be used in business presentations, financial analyses, blogs about market trends, or investment portfolios alerting to stock declines. With a focus on analytics and technology-driven insights, it appeals to audiences interested in strategy and data interpretation.
Powered by  - Get 15% off with code: PIKWIZARD15


2
downloads
downloads
Tags:
More
Credit Photo
If you would like to credit the Photo, here are some ways you can do so
Text Link
photo Link
<span class="text-link">
<span>
<a target="_blank" href=https://pikwizard.com/photo/red-down-arrow-overlaying-financial-data-graphs-for-market-prediction/25eca77dee7fe1bf4c58832f395a8e5b/>PikWizard</a>
</span>
</span>
<span class="image-link">
<span
style="margin: 0 0 20px 0; display: inline-block; vertical-align: middle; width: 100%;"
>
<a
target="_blank"
href="https://pikwizard.com/photo/red-down-arrow-overlaying-financial-data-graphs-for-market-prediction/25eca77dee7fe1bf4c58832f395a8e5b/"
style="text-decoration: none; font-size: 10px; margin: 0;"
>
<img src="https://pikwizard.com/pw/medium/25eca77dee7fe1bf4c58832f395a8e5b.jpg" style="margin: 0; width: 100%;" alt="" />
<p style="font-size: 12px; margin: 0;">PikWizard</p>
</a>
</span>
</span>
Free (free of charge)
Free for personal and commercial use.
Author: Awesome Content
Similar Free Stock Images

Premium


Premium


Premium


Premium


Premium


Premium


Premium


Premium


Premium


Premium


Premium


Premium


Premium


Premium


Premium


Premium


Premium


Premium


Premium


Premium


Premium


Premium


Premium


Premium