- Home >
- Stock Photos >
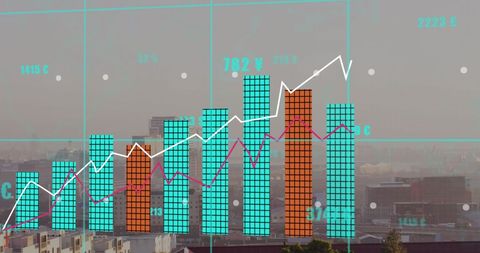
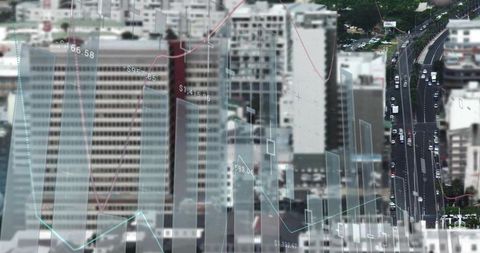
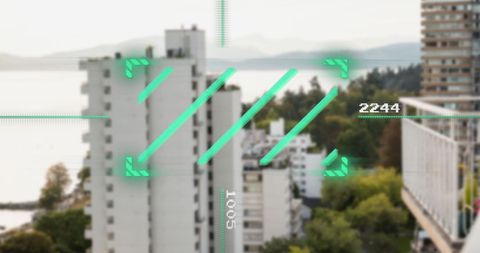
- Red Downward Arrow Crossing Urban Skyline with Teal Bar Graph and Magenta Trend Line Overlay
Red Downward Arrow Crossing Urban Skyline with Teal Bar Graph and Magenta Trend Line Overlay Image

Featuring red downward arrow cutting across desaturated urban skyline with teal bar graph and magenta trend line, conveying market decline and negative growth. Illustrating financial downturn, investment loss, and economic risk for corporate presentations, investor briefings, market analysis reports, news headlines, and business blogs. Working well as header graphic for slide decks, website banners, press releases, financial newsletters, and social media campaigns. Providing high-contrast focal point for overlaying headlines, numeric callouts, or company logos. Color palette of red, teal, magenta, and grayscale supporting modern corporate branding and urgent messaging.
Powered by  - Get 15% off with code: PIKWIZARD15


0
downloads
downloads
Tags:
More
Credit Photo
If you would like to credit the Photo, here are some ways you can do so
Text Link
photo Link
<span class="text-link">
<span>
<a target="_blank" href=https://pikwizard.com/photo/red-downward-arrow-crossing-urban-skyline-with-teal-bar-graph-and-magenta-trend-line-overlay/7a433464b3ba1e91ffeca0ab78953fe2/>PikWizard</a>
</span>
</span>
<span class="image-link">
<span
style="margin: 0 0 20px 0; display: inline-block; vertical-align: middle; width: 100%;"
>
<a
target="_blank"
href="https://pikwizard.com/photo/red-downward-arrow-crossing-urban-skyline-with-teal-bar-graph-and-magenta-trend-line-overlay/7a433464b3ba1e91ffeca0ab78953fe2/"
style="text-decoration: none; font-size: 10px; margin: 0;"
>
<img src="https://pikwizard.com/pw/medium/7a433464b3ba1e91ffeca0ab78953fe2.jpg" style="margin: 0; width: 100%;" alt="" />
<p style="font-size: 12px; margin: 0;">PikWizard</p>
</a>
</span>
</span>
Free (free of charge)
Free for personal and commercial use.
Author: Creative Art
Similar Free Stock Images

Premium


Premium


Premium


Premium


Premium


Premium


Premium


Premium


Premium


Premium


Premium


Premium


Premium


Premium


Premium


Premium


Premium


Premium


Premium


Premium


Premium


Premium


Premium


Premium


Premium