- Home >
- Stock Photos >
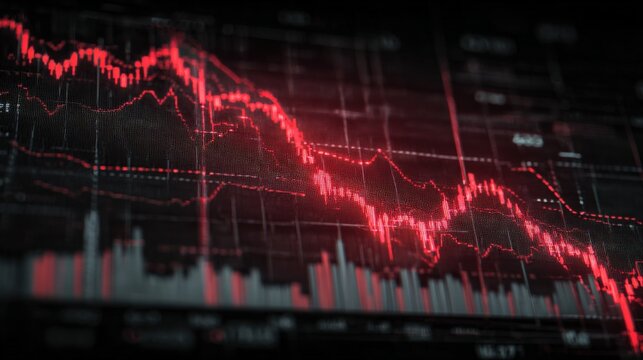
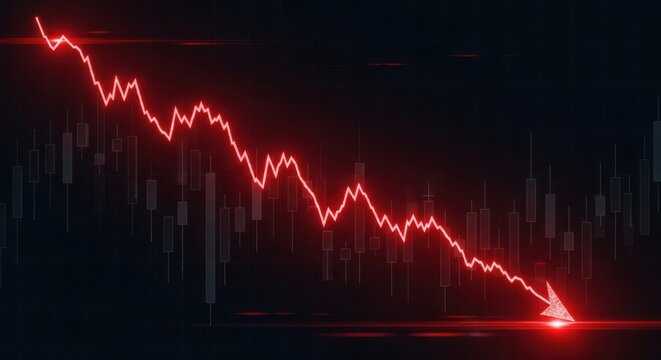
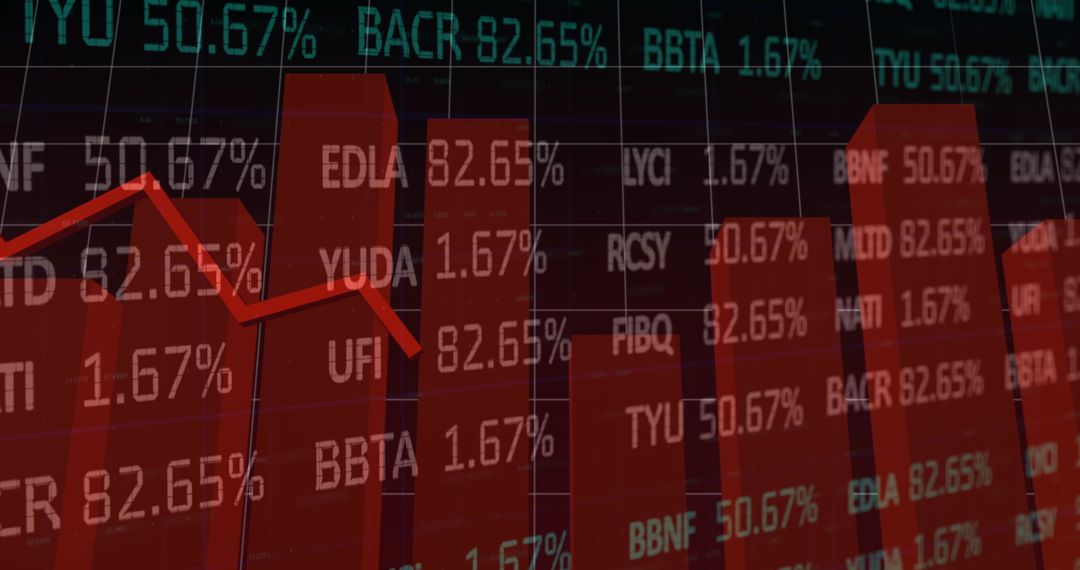
- Red Economy Chart Displays Market Downturn Digital Background
Red Economy Chart Displays Market Downturn Digital Background Image

Red economic chart displaying downward financial trends superimposed on digital financial data backdrop. Ideal for concepts related to market analysis, investment risks, economic downturn, or showcasing trading challenges. Useful for educational materials, financial presentations, or news articles illustrating financial volatility and market changes.
Powered by 


2
downloads
downloads
Tags:
More
Credit Photo
If you would like to credit the Photo, here are some ways you can do so
Text Link
photo Link
<span class="text-link">
<span>
<a target="_blank" href=https://pikwizard.com/photo/red-economy-chart-displays-market-downturn-digital-background/44455a1436c41ab5659708ac326d75df/>PikWizard</a>
</span>
</span>
<span class="image-link">
<span
style="margin: 0 0 20px 0; display: inline-block; vertical-align: middle; width: 100%;"
>
<a
target="_blank"
href="https://pikwizard.com/photo/red-economy-chart-displays-market-downturn-digital-background/44455a1436c41ab5659708ac326d75df/"
style="text-decoration: none; font-size: 10px; margin: 0;"
>
<img src="https://pikwizard.com/pw/medium/44455a1436c41ab5659708ac326d75df.jpg" style="margin: 0; width: 100%;" alt="" />
<p style="font-size: 12px; margin: 0;">PikWizard</p>
</a>
</span>
</span>
Free (free of charge)
Free for personal and commercial use.
Author: People Creations
Similar Free Stock Images

Premium


Premium


Premium


Premium


Premium


Premium


Premium


Premium


Premium


Premium


Premium


Premium


Premium


Premium


Premium


Premium


Premium


Premium


Premium


Premium


Premium


Premium


Premium


Premium