1. Home > 
  2. Stock Photos > 
  3. Red Falling Stock Graph Over Urban Skyline Indicating Decline

Red Falling Stock Graph Over Urban Skyline Indicating Decline Image

Red Falling Stock Graph Over Urban Skyline Indicating Decline

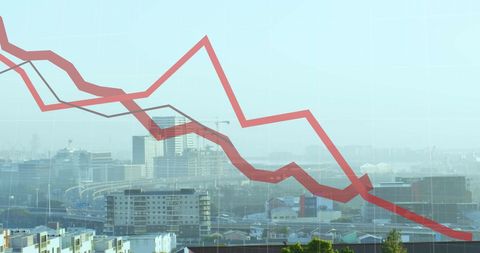
Graph red lines showing a decline superimposed on city buildings. Ideal for illustrating market downturns, economic instability, financial risk or urban economic impact topics in reports, presentations, and articles.

Powered by Shutterstock logo - Get 15% off with code: PIKWIZARD15
Economic crisis and global economic recession. Economic stagnation and inflation, Business investment risks. Businessman using laptop to analyze economic graph. - Powered by Shutterstock - Get 15% off with code: PIKWIZARD15Economic crisis that will affect the world in 2022 after Russia invasion of Ukraine. Bankruptcy and declining stocks - Powered by Shutterstock - Get 15% off with code: PIKWIZARD15Economic crisis concept shown by declining graphs and digital indicators overlap modernistic city background. Double exposure. - Powered by Shutterstock - Get 15% off with code: PIKWIZARD15recession economy stock crash red market trade war economic world financial / business and stock crisis and markets down because of pandemic coronavirus COVID-2019 or relationship usa china - Powered by Shutterstock - Get 15% off with code: PIKWIZARD15Stock crash market exchange loss trading graph analysis investment indicator business graph charts of financial digital background down stock crisis red price in down trend chart fall - Powered by Shutterstock - Get 15% off with code: PIKWIZARD15

Credit Photo

If you would like to credit the Photo, here are some ways you can do so

Free (free of charge)

Free for personal and commercial use.

Author: Awesome Content

Similar Free Stock Images

Abstract Financial Data Visualization with Dynamic Graphs
Premium
recession economy stock crash red market trade war economic world financial / business and stock crisis and markets down because of pandemic coronavirus COVID-2019 or relationship usa china
Financial Graphs Overlaying Warehouse Logistics Background
Financial Data Analytics with Graphs Over Urban Architecture
Financial Data with Market Trends and Modern Architecture
Businesswoman Analyzing Financial Markets with Team
Premium
Stack of coins bar chart and red graph trending downwards with white wall background on wooden table copy space. Economy recession crisis, inflation, stagflation, business and financial loss concept.
Dynamic Line Graph on Business Office Background Depicting Growth
Financial Growth Data Over Urban Skyline
Economic Downturn During Health Crisis Visualization
Digital Financial Decline Concepts Overlaying Cityscape
Premium
Stressed business man crypto trader broker investor analyzing stock exchange market crypto trading decreasing chart data fall down loss, desperate about losing money of crisis, recession, inflation.
Statistical Data Analysis with Relaxed Businessman
Decreasing Trend Graph Over Urban Cityscape at Dusk
Rising Green Graph Lines over Business Data
Financial Charts Displaying Market Volatility Trends
Premium
Financial graph with a red falling trend line overlay on a cityscape background, symbolizing a market downturn and financial crisis
Financial Data Graph with Rising Green Line and Analytics Dashboard
Economic Decline Graph Overlay on Cityscape Depicting Uncertainty
Business Presentation with Interactive Data Visualization
Eco-Friendly Finance Concept with Digital Analytics
Premium
Economic crisis that will seriously affect Russia in 2022 due to the conflict with Ukraine. Bankruptcy and crisis concept.
Economic Downtrend Overlaid on Urban Skyline
Financial Data Visualization Over Ocean Scenery
Financial Growth Chart Over Diverse Team Collaboration in Modern Office
Declining Trend Over Modern Cityscape With Data Overlays
Premium
Stock market crash, declined economic, graph falling down and digital indicators overlaps modernistic city. Double exposure.
Finance Graphs Over Skyscrapers Depicting Economic Trends
Graph Decline with Businessman Reflected in Economic Concept
Urban Skyline with Financial Graph Overlay in Red Tones
Business Team Analyzing Financial Data with Overlay of Declining Graph
Financial Data Processing Over Cityscape Urban Analysis
Green Line Graph and Data Elements on Industrial Landfill
Premium
Businessman grabs the head concept with business chart on scoreboard
Financial Growth Algorithms Over City View with Green and Red Lines
Digital Graph Overlay in Warehouse Environment Background
Financial Graphs Overlapping with Businesspeople Walking
Financial Data Overlay on Cityscape Digital Concept
Premium
Illustration of the crisis concept with a businessman in panic
Dynamic Red Line Graph on Dark Background Depicting Financial Crisis
Red Data Line Overlay on Cityscape Represents Financial Trends
Financial Decline Over Urban Skyline Illustrating Market Trends
Colorful Graphs Indicating Financial Data Analysis Over Grid Background
Premium
Manipulating the losses or cheating the charts
Dynamic Growth Chart Overlaying Urban Skyline
Falling Statistics with Red Graph on Digital Interface
Dynamic Financial Growth Chart in Modern Office
Dynamic Statistical Graphs on Gradient Background
Premium
A businessman in despair with his hands on his head against a background with declining stock market graphs, highlighting financial crisis concept
Financial Growth Graph Overlay on Server Room Infrastructure
Financial Data Processing and Analysis with Digital Interface
Financial Data Overlay Above Urban Skyline
Growing Success Trend with Data Chart over Pink Gradient
Premium
Miniature figure standing with USD banknote and stock market graph chart for United States of America have economic recession crisis concept
Financial Graphs Over Scenic Seascape Background Symbolizing Market Trends
Financial Growth Over Urban Skyline with Colorful Financial Graphs
Financial Data Graph Over Misty Urban Cityscape
Digital Data Analytics Overlay on Urban Skyline
Premium
Close up of backlit hands using laptop at desk with red crisis arrows on blurry background. Economic recession, financial fall and crash concept. Double exposure
Businesswoman Analyzing Data with Strategic Focus in Modern Office
Red Line Chart Over Forest Stream Illustrating Economic Downtrend
Data Trend Lines Over Oceanic Minimalistic Visualization
Financial Growth Graphs Against Cityscape with Equalizer Effect
Financial Market Decline Illustrated on Grid Chart
Financial Growth and Market Trends Over Urban Skyline
Premium
Investing and real estate market crash concept with falling down digital financial chart candlestick and graphs with data indicators on city modern business centers background, double exposure
Dynamic Data Trends Over Digital Graph with Pink Background
Urban Cityscape overlaid with Financial Graph Trends
Financial Data Visualization with Declining Red Line Graph
Conceptual Line Graphs Highlighting Economic Decline over Pollution
Premium
Property values ​​are steadily declining. business downturn. company stocks fall in value, economic crisis, the global economy slows down, trading drops, high risk investments.
Economic Downturn Concept Against City Skyline
Co-workers Collaborating in Office with Overlaying Business Graphs
Green Line Graph Showing Upward Financial Trends and Growth
Stock Market Decline Concept with Business Figures
Premium
recession economy stock crash red market trade war economic world financial / business and stock crisis and markets down because of pandemic coronavirus COVID-2019 or relationship usa china
Graph Visualizing Economic Downtrend and Financial Data
Falling Line Graph Illustrates Decreasing Financial Trends
Descending Red Line on Beach Background Illustrates Financial Decline
Green Line Graph Indicating Economic Growth Over Cityscape
Premium
Red graph on smartphone with blurry computer monitor showing stock price slump. The concepts of the economic downturn from Covid 19 and world fuel energy.
Financial Data Overlapping Urban Skyline
Financial Growth and Urban Landscape Concept
Digital Icons and Data Trends in Server Room Environment
Financial Graph Overlaid on Seascape Symbolizing Market Analysis
Premium
Red Bitcoin Candlestick Chart with US Dollar bills in the Background, crypto market crash. Stock Market collapse and Exchange volatility. Bitcoin Price Evolution. Financial risk, panic and devaluation
Rising Graphs and Cityscape Showing Business Trends
Digital Financial Graphs Overlapping Modern Office Scene
Red Line Graph Showing Financial Decline on Grid Background
Financial Data Visualization Over Serene Bay Area Skyscape
Premium
crisis economic global to red graph chart. war to Impact Business and industry. concept of financial bank economy downturn, bubble bursting crisis, down the stock market in recession, risk investment
Audio Engineer Adjusting Console with Data Graph Overlay
Dynamic Financial Growth Trends with Analytics Visualization
Financial Data Trends with Modern Architecture Overlay
Financial Decline on Digital Warehouse Background
Cityscape with Declining Financial Graph Overlay
Financial Data Trends Against Modern Skyscraper Background
Premium
Wooden blocks with percentage sign and down arrow, financial recession crisis, interest rate decline, investment reduce, risk management concept
Financial Graph Overlay on Diverse Team in Business Setting
Complex Data Analysis with Interactive Charts and Arrows
Rising Trends in Financial Markets Overlay on Cityscape
Server Room Data Analytics with Declining Graph Representation
Premium
Depressed businessman in economic crisis with line graph showing negative trend
Diverse Team Analyzing Declining Business Graphs in Modern Office
Rising Graph Line Over Digital Grid Background
Fluctuating Line Graph Over Abandoned Factory Scene
Declining Financial Chart with Red Lines on Data Grid
Premium
Economic crisis concept shown by declining graphs and digital indicators overlap modernistic city background. Double exposure.
Global Financial Data Analytics with Downward Trend Graph
City Skyline with Financial Graphs Illustrating Economic Growth
Declining Economic Chart Over Sunny Cityscape at Dusk
Business Team Analyzing Statistics with Digital Graph Overlay
Premium
Economic crisis concept shown by declining graphs and digital indicators overlap modernistic city background. Double exposure.
Financial Downtrend in Urban Overview with Silhouettes
Futuristic Data Visualization over Cityscape in Cloudy Setting
Financial Graph Overlay on Scenic Landscape
Business Colleagues Analyzing Rising and Falling Financial Graphs
Premium
Stocks price in downtrend mode indicates global economy enter recession
Dynamic Cityscape with Rising Line Graph Overlay
Ascending Green Line Graph Overlay on Urban Skyline for Business Growth Concept
Dynamic Green Business Data Graph with Office Backdrop
Bright Green Financial Graph over Serene Lake at Dusk
Premium
Stock markets crash, stock down. Graphs against a city people abstract background
Global Market Trends Featuring Multi-Series Line Charts Over Dotted World Map and Grid