
- Home >
- Stock Photos >
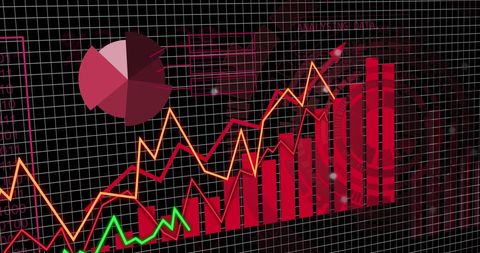
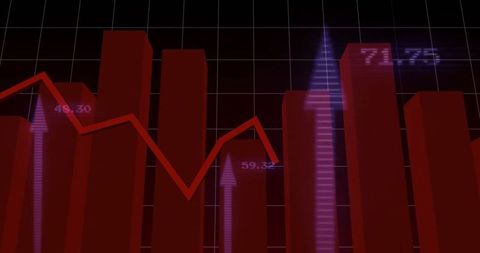
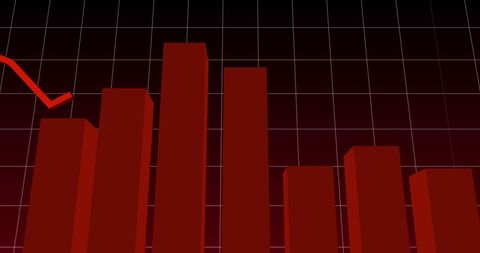
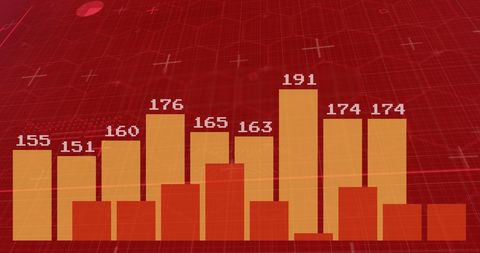
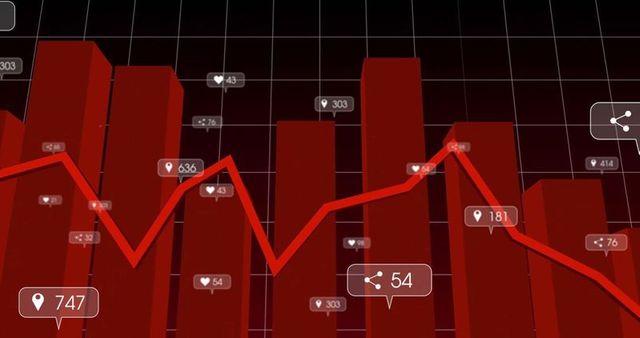
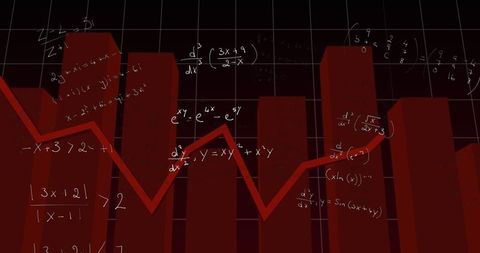
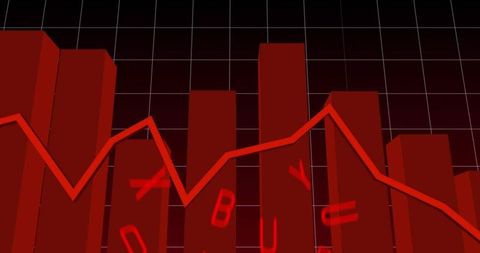
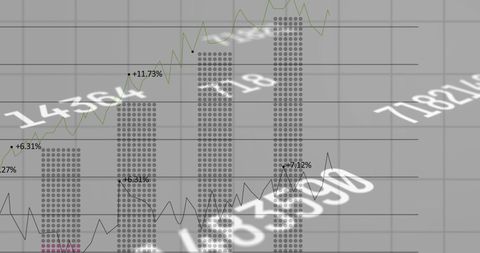
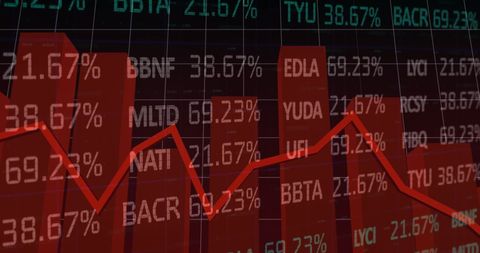
- Red Financial Bar Graph with Statistical Analysis
Red Financial Bar Graph with Statistical Analysis Image
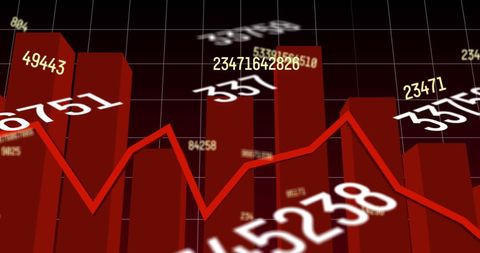
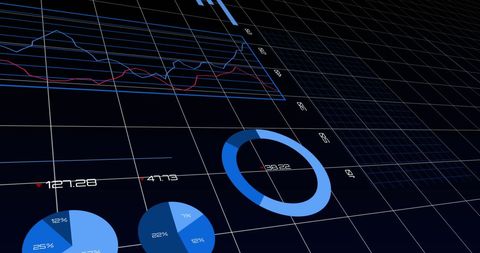
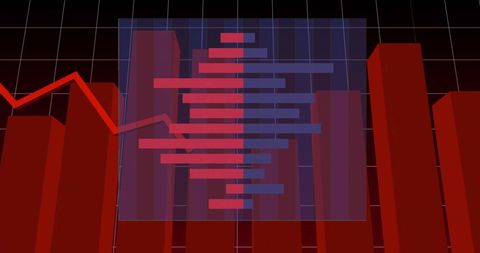
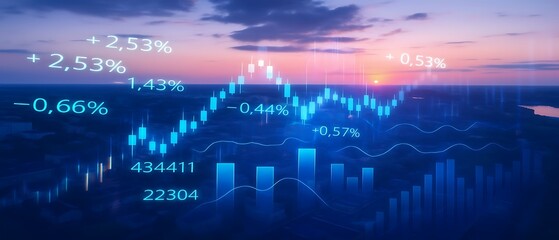
Red graphical representation of financial data featuring bar charts and numerical analysis conveys business and economic metrics. Suitable for illustrating concepts in financial essays, investment articles, economic news reports, and educational publications discussing market trends or economic statistics.
Powered by 


downloads
Tags:
More
Credit Photo
If you would like to credit the Photo, here are some ways you can do so
Text Link
photo Link
<span class="text-link">
<span>
<a target="_blank" href=https://pikwizard.com/photo/red-financial-bar-graph-with-statistical-analysis/dd482a66b5e60a4723cada4916c2d96d/>PikWizard</a>
</span>
</span>
<span class="image-link">
<span
style="margin: 0 0 20px 0; display: inline-block; vertical-align: middle; width: 100%;"
>
<a
target="_blank"
href="https://pikwizard.com/photo/red-financial-bar-graph-with-statistical-analysis/dd482a66b5e60a4723cada4916c2d96d/"
style="text-decoration: none; font-size: 10px; margin: 0;"
>
<img src="https://pikwizard.com/pw/medium/dd482a66b5e60a4723cada4916c2d96d.jpg" style="margin: 0; width: 100%;" alt="" />
<p style="font-size: 12px; margin: 0;">PikWizard</p>
</a>
</span>
</span>
Free (free of charge)
Free for personal and commercial use.
Author: Awesome Content
Similar Free Stock Images
Premium
Premium

Premium


Premium

Premium


Premium


Premium


Premium


Premium


Premium

Premium


Premium


Premium


Premium


Premium


Premium


Premium


Premium


Premium


Premium


Premium


Premium


Premium


Premium


Premium
Explore More Free Stock Images