- Home >
- Stock Photos >
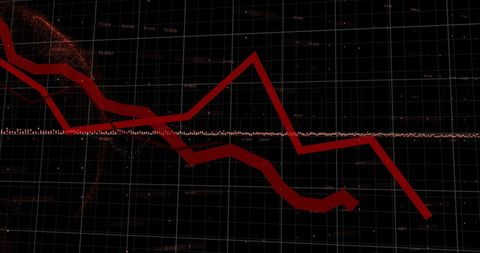
- Red Financial Graph Indicates Declining Market Trends
Red Financial Graph Indicates Declining Market Trends Image

Red financial graph overlay on interconnecting lines shows economic decline concept. Useful for illustrating trends in finance, economic forecasts, market analysis, data visualization, and stock market reports.
Powered by  - Get 15% off with code: PIKWIZARD15


2
downloads
downloads
Tags:
More
Credit Photo
If you would like to credit the Photo, here are some ways you can do so
Text Link
photo Link
<span class="text-link">
<span>
<a target="_blank" href=https://pikwizard.com/photo/red-financial-graph-indicates-declining-market-trends/689d7ed5cdd1a8ad6859e4290cd5a780/>PikWizard</a>
</span>
</span>
<span class="image-link">
<span
style="margin: 0 0 20px 0; display: inline-block; vertical-align: middle; width: 100%;"
>
<a
target="_blank"
href="https://pikwizard.com/photo/red-financial-graph-indicates-declining-market-trends/689d7ed5cdd1a8ad6859e4290cd5a780/"
style="text-decoration: none; font-size: 10px; margin: 0;"
>
<img src="https://pikwizard.com/pw/medium/689d7ed5cdd1a8ad6859e4290cd5a780.jpg" style="margin: 0; width: 100%;" alt="" />
<p style="font-size: 12px; margin: 0;">PikWizard</p>
</a>
</span>
</span>
Free (free of charge)
Free for personal and commercial use.
Author: Creative Art
Similar Free Stock Images

Premium


Premium


Premium


Premium


Premium


Premium


Premium


Premium


Premium


Premium


Premium


Premium


Premium


Premium


Premium


Premium


Premium


Premium


Premium


Premium


Premium


Premium


Premium


Premium


Premium