- Home >
- Stock Photos >
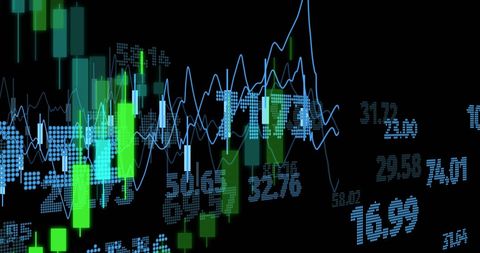
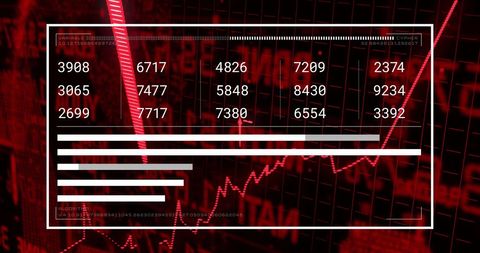
- Red Financial Market Data with Declining Graph Trends
Red Financial Market Data with Declining Graph Trends Image

Visual representation of red financial data and stock market trends, useful for illustrating themes related to investment challenges, market volatility, economic downturns, or finance articles. Perfect for presentations, financial blogs, and educational materials focusing on market analysis and stock trading risks.

downloads
Tags:
More
Credit Photo
If you would like to credit the Photo, here are some ways you can do so
Text Link
photo Link
<span class="text-link">
<span>
<a target="_blank" href=https://pikwizard.com/photo/red-financial-market-data-with-declining-graph-trends/3d651ee4268c8317e4d6ca5526d9efb3/>PikWizard</a>
</span>
</span>
<span class="image-link">
<span
style="margin: 0 0 20px 0; display: inline-block; vertical-align: middle; width: 100%;"
>
<a
target="_blank"
href="https://pikwizard.com/photo/red-financial-market-data-with-declining-graph-trends/3d651ee4268c8317e4d6ca5526d9efb3/"
style="text-decoration: none; font-size: 10px; margin: 0;"
>
<img src="https://pikwizard.com/pw/medium/3d651ee4268c8317e4d6ca5526d9efb3.jpg" style="margin: 0; width: 100%;" alt="" />
<p style="font-size: 12px; margin: 0;">PikWizard</p>
</a>
</span>
</span>
Free (free of charge)
Free for personal and commercial use.
Author: Awesome Content