- Home >
- Stock Photos >
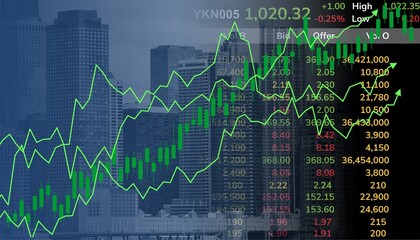
- Red Financial Trendline in Digital Interface Background
Red Financial Trendline in Digital Interface Background Image

Dynamic visualization showing financial data interpretation with a sharp red line indicating trends across a digital backdrop. Use this for topics in finance analytics, market forecasting, or global economic discussions.
Powered by 


2
downloads
downloads
Tags:
More
Credit Photo
If you would like to credit the Photo, here are some ways you can do so
Text Link
photo Link
<span class="text-link">
<span>
<a target="_blank" href=https://pikwizard.com/photo/red-financial-trendline-in-digital-interface-background/b131a6407e6cf96c341f77aa9a4ce797/>PikWizard</a>
</span>
</span>
<span class="image-link">
<span
style="margin: 0 0 20px 0; display: inline-block; vertical-align: middle; width: 100%;"
>
<a
target="_blank"
href="https://pikwizard.com/photo/red-financial-trendline-in-digital-interface-background/b131a6407e6cf96c341f77aa9a4ce797/"
style="text-decoration: none; font-size: 10px; margin: 0;"
>
<img src="https://pikwizard.com/pw/medium/b131a6407e6cf96c341f77aa9a4ce797.jpg" style="margin: 0; width: 100%;" alt="" />
<p style="font-size: 12px; margin: 0;">PikWizard</p>
</a>
</span>
</span>
Free (free of charge)
Free for personal and commercial use.
Author: Creative Art
Similar Free Stock Images

Premium


Premium


Premium


Premium


Premium


Premium


Premium


Premium


Premium


Premium


Premium


Premium


Premium


Premium


Premium


Premium


Premium


Premium


Premium


Premium


Premium


Premium


Premium


Premium


Premium