- Home >
- Stock Photos >
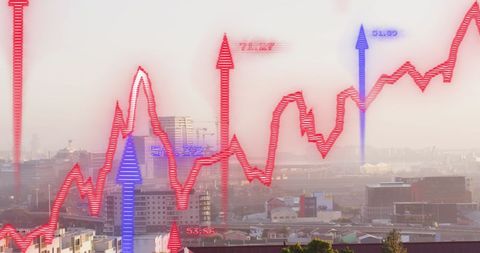
- Red Graph Falling over Black and White Office Background
Red Graph Falling over Black and White Office Background Image

Ideal for illustrating concepts related to financial challenges, economic downturns, or changing market trends, this visual combines abstract data elements with a professional office backdrop to highlight business analysis and global finance themes. Useful for presentations, articles, or reports focusing on economic forecast and investment strategies.
Powered by  - Get 15% off with code: PIKWIZARD15


2
downloads
downloads
Tags:
More
Credit Photo
If you would like to credit the Photo, here are some ways you can do so
Text Link
photo Link
<span class="text-link">
<span>
<a target="_blank" href=https://pikwizard.com/photo/red-graph-falling-over-black-and-white-office-background/a1cb87d42730bb4ac389fd37260b97d9/>PikWizard</a>
</span>
</span>
<span class="image-link">
<span
style="margin: 0 0 20px 0; display: inline-block; vertical-align: middle; width: 100%;"
>
<a
target="_blank"
href="https://pikwizard.com/photo/red-graph-falling-over-black-and-white-office-background/a1cb87d42730bb4ac389fd37260b97d9/"
style="text-decoration: none; font-size: 10px; margin: 0;"
>
<img src="https://pikwizard.com/pw/medium/a1cb87d42730bb4ac389fd37260b97d9.jpg" style="margin: 0; width: 100%;" alt="" />
<p style="font-size: 12px; margin: 0;">PikWizard</p>
</a>
</span>
</span>
Free (free of charge)
Free for personal and commercial use.
Author: Awesome Content
Similar Free Stock Images

Premium


Premium


Premium


Premium


Premium


Premium


Premium


Premium


Premium


Premium


Premium


Premium


Premium


Premium


Premium


Premium


Premium


Premium


Premium


Premium


Premium


Premium


Premium


Premium


Premium