- Home >
- Stock Photos >
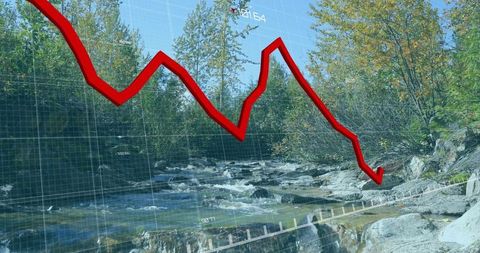
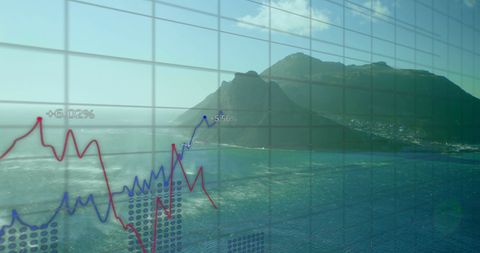
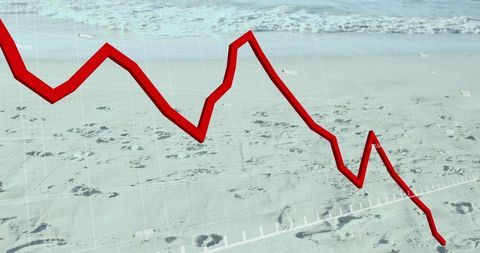
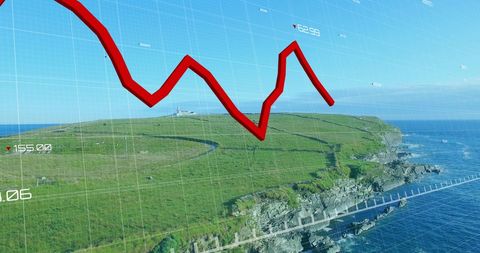
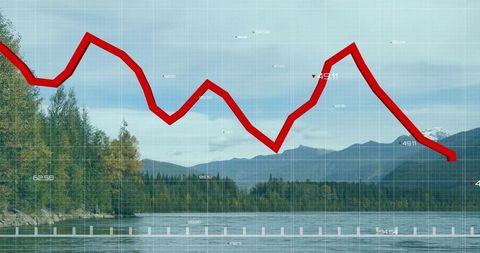
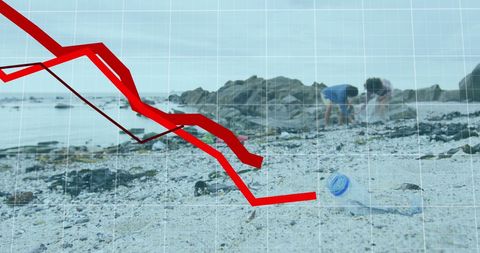
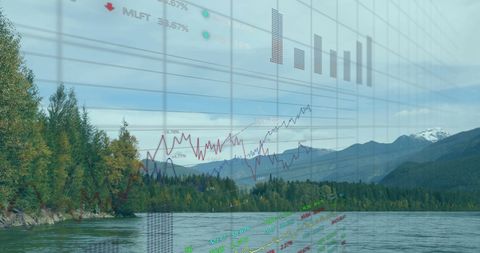
- Red Graph Line Overlay on Scenic Seascape Indicates Market Trends
Red Graph Line Overlay on Scenic Seascape Indicates Market Trends Image
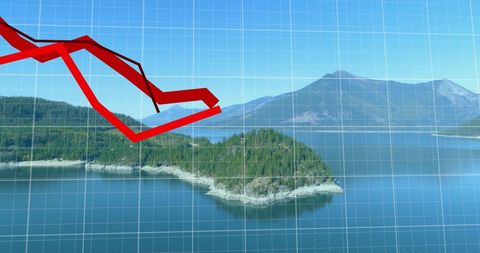
A red graph line overlays a tranquil seascape with mountains, symbolizing fluctuating market trends. This visual juxtaposition of natural beauty with financial metrics makes it suitable for illustrating topics related to economic forecasts in natural resources sectors, global finance reports, and market analysis with an environmental backdrop.
Powered by  - Get 15% off with code: PIKWIZARD15


2
downloads
downloads
Tags:
More
Credit Photo
If you would like to credit the Photo, here are some ways you can do so
Text Link
photo Link
<span class="text-link">
<span>
<a target="_blank" href=https://pikwizard.com/photo/red-graph-line-overlay-on-scenic-seascape-indicates-market-trends/9541c5f248b304169d6cc975a88285f2/>PikWizard</a>
</span>
</span>
<span class="image-link">
<span
style="margin: 0 0 20px 0; display: inline-block; vertical-align: middle; width: 100%;"
>
<a
target="_blank"
href="https://pikwizard.com/photo/red-graph-line-overlay-on-scenic-seascape-indicates-market-trends/9541c5f248b304169d6cc975a88285f2/"
style="text-decoration: none; font-size: 10px; margin: 0;"
>
<img src="https://pikwizard.com/pw/medium/9541c5f248b304169d6cc975a88285f2.jpg" style="margin: 0; width: 100%;" alt="" />
<p style="font-size: 12px; margin: 0;">PikWizard</p>
</a>
</span>
</span>
Free (free of charge)
Free for personal and commercial use.
Author: People Creations
Similar Free Stock Images
Loading...

Premium


Premium


Premium


Premium

Premium


Premium


Premium


Premium


Premium


Premium


Premium


Premium

Premium

Premium


Premium


Premium

Premium

Premium


Premium


Premium


Premium


Premium


Premium


Premium


Premium