- Home >
- Stock Photos >
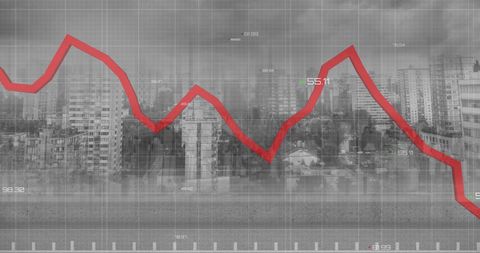
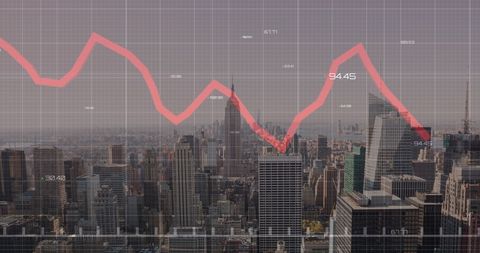
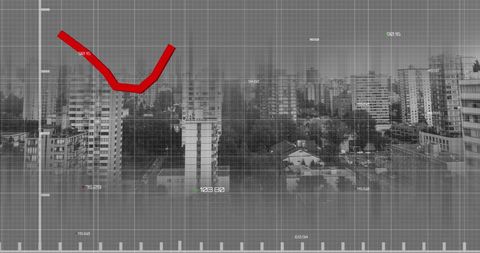
- Red Graph Line Overlaying Cityscape Represents Market Trends
Red Graph Line Overlaying Cityscape Represents Market Trends Image

Dynamic cityscape backdrop with prominent red graph line highlighting financial market trends. The grayscale urban skyline combined with sharp red trend line represents a sense of financial analysis, market fluctuations, and business strategy. Ideal for use in presentations, reports on economic studies, or educational references demonstrating urban and economic analysis.
Powered by 


downloads
Tags:
More
Credit Photo
If you would like to credit the Photo, here are some ways you can do so
Text Link
photo Link
<span class="text-link">
<span>
<a target="_blank" href=https://pikwizard.com/photo/red-graph-line-overlaying-cityscape-represents-market-trends/8299f4034c2922978ed9ef193a0b8c8c/>PikWizard</a>
</span>
</span>
<span class="image-link">
<span
style="margin: 0 0 20px 0; display: inline-block; vertical-align: middle; width: 100%;"
>
<a
target="_blank"
href="https://pikwizard.com/photo/red-graph-line-overlaying-cityscape-represents-market-trends/8299f4034c2922978ed9ef193a0b8c8c/"
style="text-decoration: none; font-size: 10px; margin: 0;"
>
<img src="https://pikwizard.com/pw/medium/8299f4034c2922978ed9ef193a0b8c8c.jpg" style="margin: 0; width: 100%;" alt="" />
<p style="font-size: 12px; margin: 0;">PikWizard</p>
</a>
</span>
</span>
Free (free of charge)
Free for personal and commercial use.
Author: Awesome Content
Similar Free Stock Images
Loading...

Premium


Premium


Premium

Premium


Premium


Premium


Premium

Premium


Premium


Premium


Premium

Premium


Premium


Premium

Premium


Premium

Premium


Premium

Premium


Premium


Premium


Premium


Premium


Premium


Premium