- Home >
- Stock Photos >
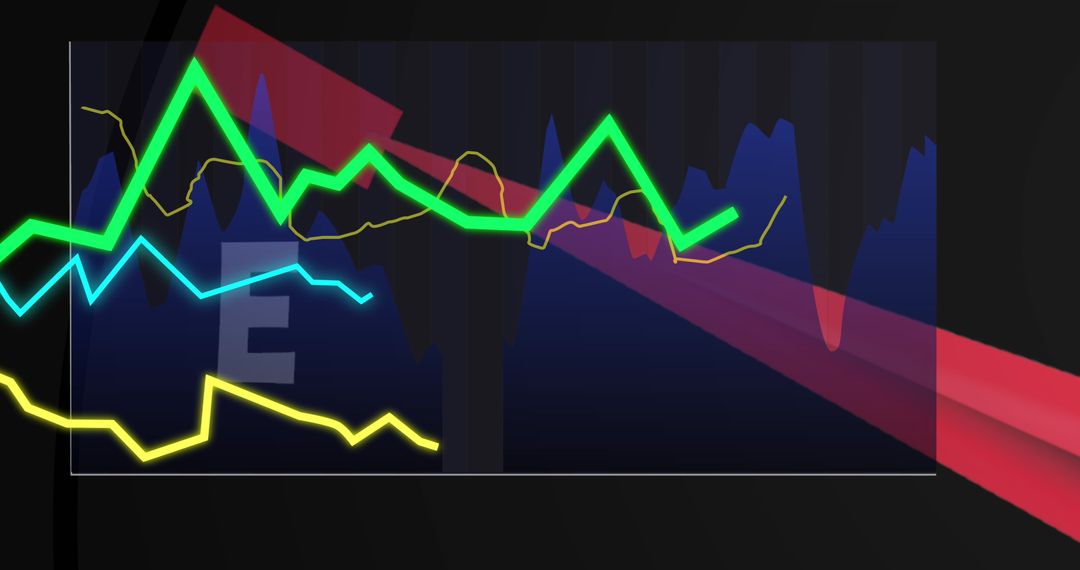
- Red Graph Overlay on Pencil with Blue Background Illustrating Decline
Red Graph Overlay on Pencil with Blue Background Illustrating Decline Image

Close-up of pencil under a red graph line showing decline against a soft blue background. Emphasizes trends, analysis, and financial or educational downfall themes. Ideal for articles on economy, academic performance analytics, and technology in education. Great visual for presentations and reports discussing negative trends or decline in data figures.
Powered by 


2
downloads
downloads
Tags:
More
Credit Photo
If you would like to credit the Photo, here are some ways you can do so
Text Link
photo Link
<span class="text-link">
<span>
<a target="_blank" href=https://pikwizard.com/photo/red-graph-overlay-on-pencil-with-blue-background-illustrating-decline/f7ff5980fc1b36cb05c4f9526453cc34/>PikWizard</a>
</span>
</span>
<span class="image-link">
<span
style="margin: 0 0 20px 0; display: inline-block; vertical-align: middle; width: 100%;"
>
<a
target="_blank"
href="https://pikwizard.com/photo/red-graph-overlay-on-pencil-with-blue-background-illustrating-decline/f7ff5980fc1b36cb05c4f9526453cc34/"
style="text-decoration: none; font-size: 10px; margin: 0;"
>
<img src="https://pikwizard.com/pw/medium/f7ff5980fc1b36cb05c4f9526453cc34.jpg" style="margin: 0; width: 100%;" alt="" />
<p style="font-size: 12px; margin: 0;">PikWizard</p>
</a>
</span>
</span>
Free (free of charge)
Free for personal and commercial use.
Author: People Creations
Similar Free Stock Images

Premium


Premium


Premium


Premium


Premium


Premium


Premium


Premium


Premium


Premium


Premium


Premium


Premium


Premium


Premium


Premium


Premium


Premium


Premium


Premium


Premium


Premium


Premium


Premium