- Home >
- Stock Photos >
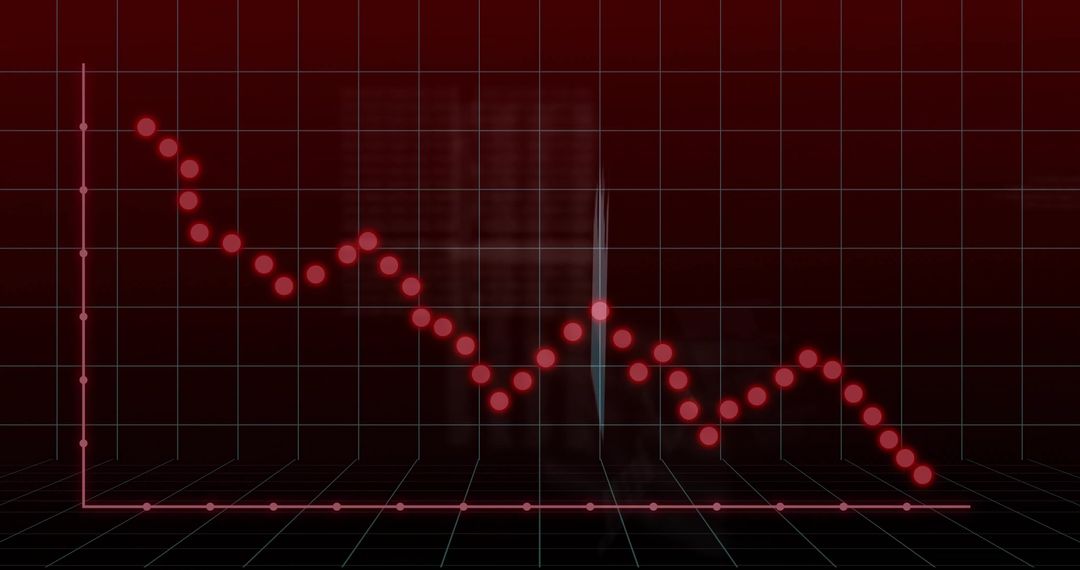
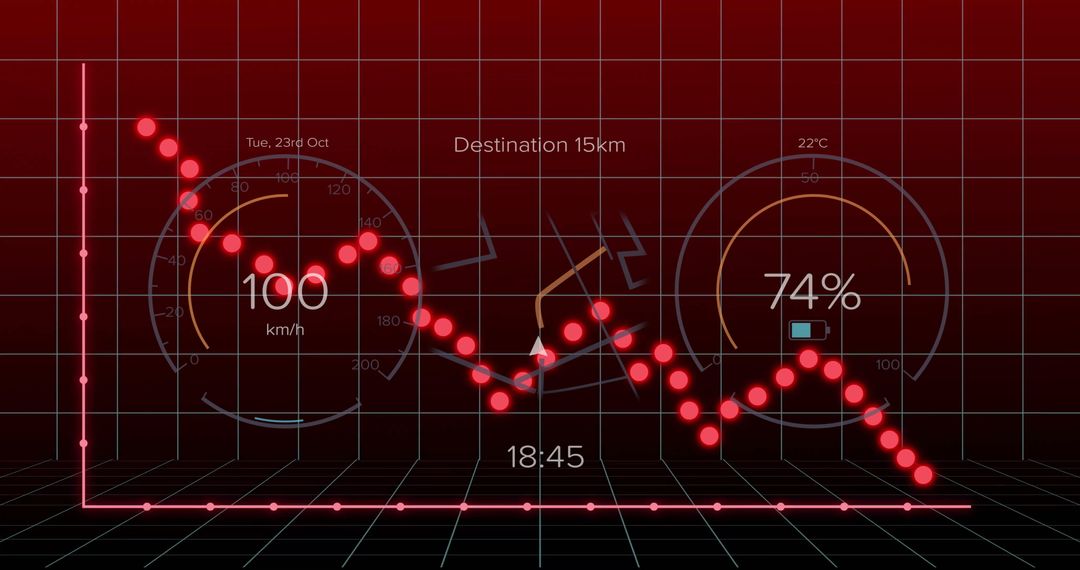
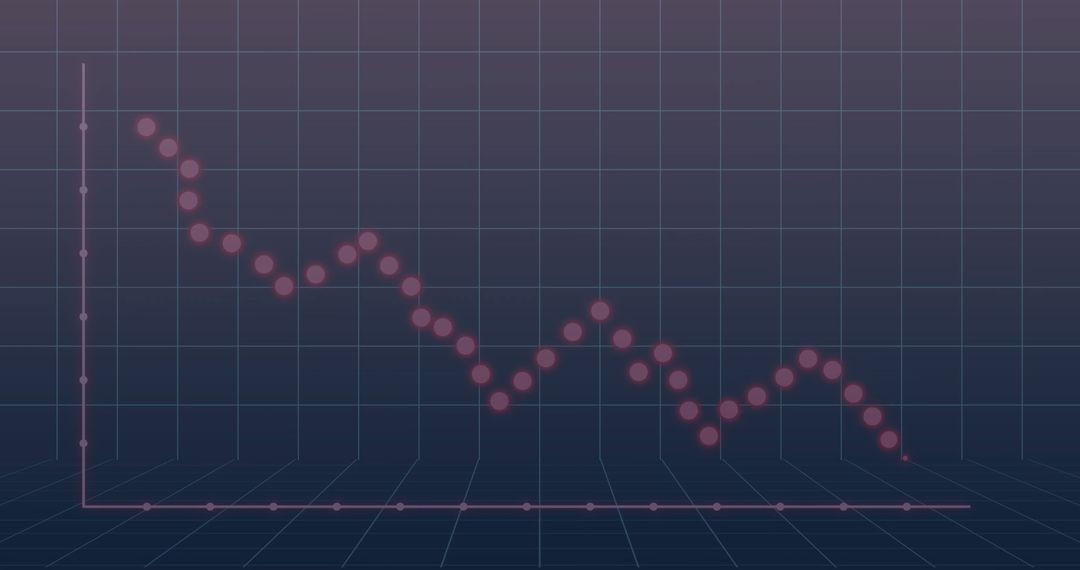
- Red Graph Showing Downward Trend on Digital Grid
Red Graph Showing Downward Trend on Digital Grid Image

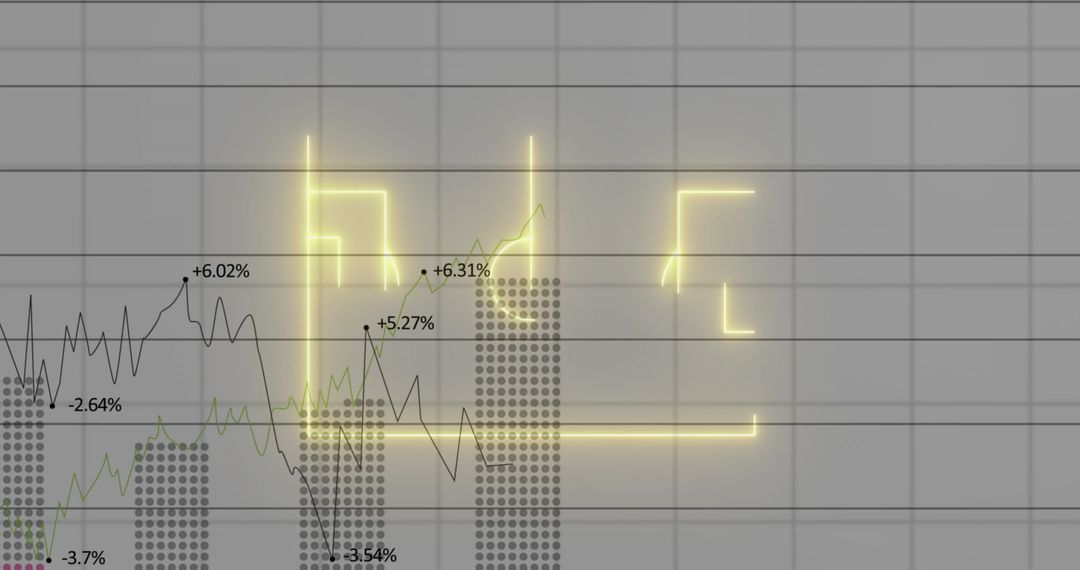
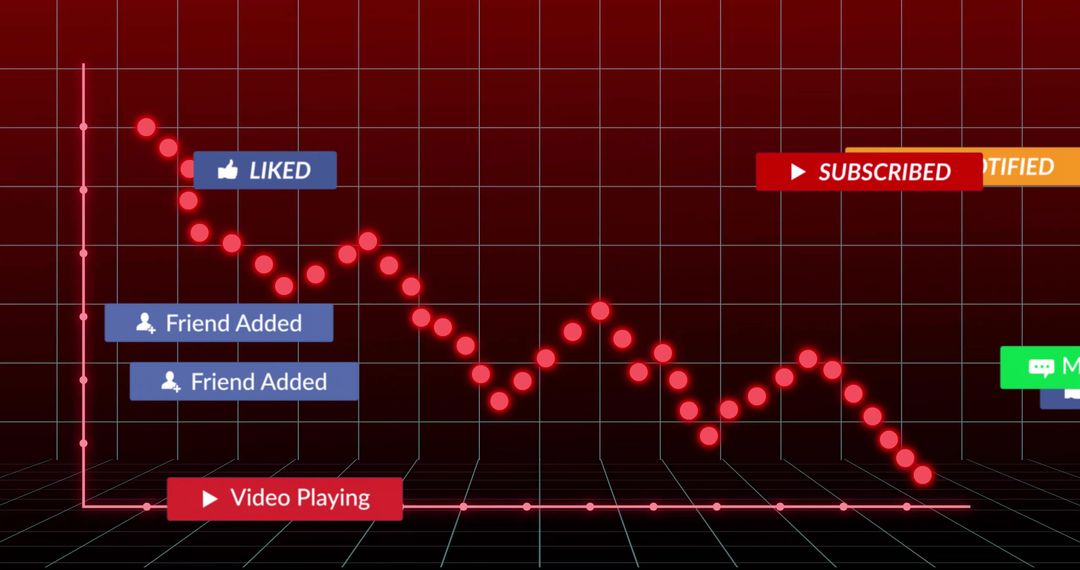
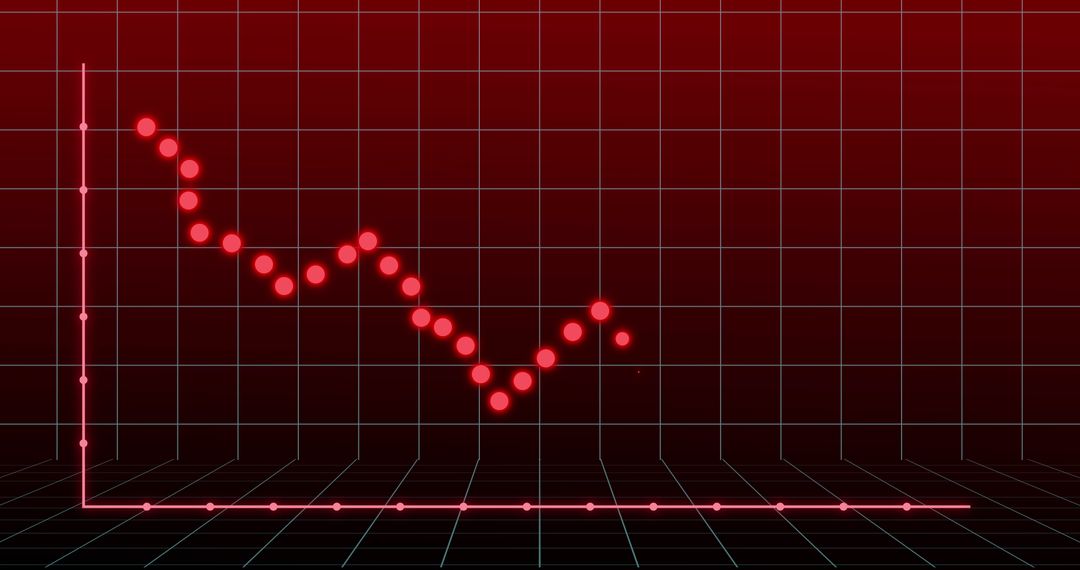
Graph showing a downward financial trend over a digital red background and gridlines, depicting data analysis, stock markets, or economic updates. Useful for articles on market performance, presentations on financial instability, or technology and data tracking tools.
Powered by  - Get 15% off with code: PIKWIZARD15


3
downloads
downloads
Tags:
More
Credit Photo
If you would like to credit the Photo, here are some ways you can do so
Text Link
photo Link
<span class="text-link">
<span>
<a target="_blank" href=https://pikwizard.com/photo/red-graph-showing-downward-trend-on-digital-grid/766686adee78dd2534f1ad9b8e911efd/>PikWizard</a>
</span>
</span>
<span class="image-link">
<span
style="margin: 0 0 20px 0; display: inline-block; vertical-align: middle; width: 100%;"
>
<a
target="_blank"
href="https://pikwizard.com/photo/red-graph-showing-downward-trend-on-digital-grid/766686adee78dd2534f1ad9b8e911efd/"
style="text-decoration: none; font-size: 10px; margin: 0;"
>
<img src="https://pikwizard.com/pw/medium/766686adee78dd2534f1ad9b8e911efd.jpg" style="margin: 0; width: 100%;" alt="" />
<p style="font-size: 12px; margin: 0;">PikWizard</p>
</a>
</span>
</span>
Free (free of charge)
Free for personal and commercial use.
Author: People Creations
Similar Free Stock Images

Premium


Premium


Premium


Premium


Premium


Premium


Premium


Premium


Premium


Premium


Premium


Premium


Premium


Premium


Premium


Premium


Premium


Premium


Premium


Premium


Premium


Premium


Premium


Premium