- Home >
- Stock Photos >
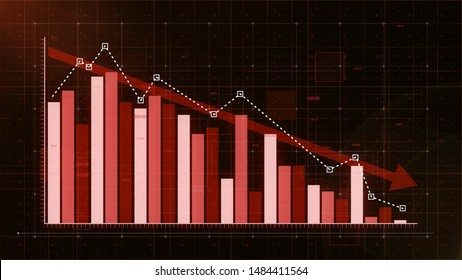
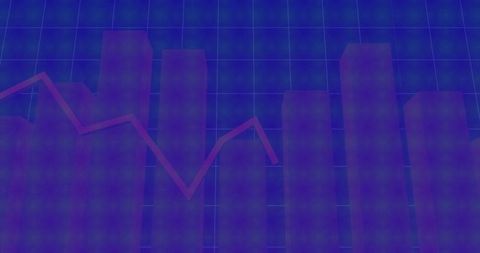
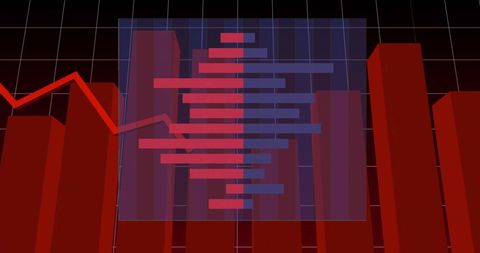
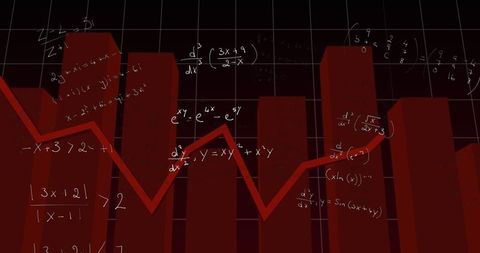
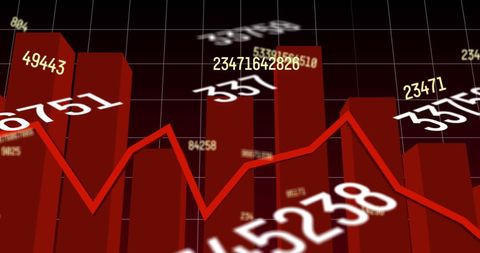
- Red Line Graph Depicting Financial Market Analysis with Bar Chart
Red Line Graph Depicting Financial Market Analysis with Bar Chart Image

Graphic is useful for presentations on financial analysis, showing trends or fluctuations in stock markets or economic data. Appropriate for illustrating concepts in business reports or economic research.
Powered by  - Get 15% off with code: PIKWIZARD15


2
downloads
downloads
Tags:
More
Credit Photo
If you would like to credit the Photo, here are some ways you can do so
Text Link
photo Link
<span class="text-link">
<span>
<a target="_blank" href=https://pikwizard.com/photo/red-line-graph-depicting-financial-market-analysis-with-bar-chart/4eece5be34e769d17229e643d3abf713/>PikWizard</a>
</span>
</span>
<span class="image-link">
<span
style="margin: 0 0 20px 0; display: inline-block; vertical-align: middle; width: 100%;"
>
<a
target="_blank"
href="https://pikwizard.com/photo/red-line-graph-depicting-financial-market-analysis-with-bar-chart/4eece5be34e769d17229e643d3abf713/"
style="text-decoration: none; font-size: 10px; margin: 0;"
>
<img src="https://pikwizard.com/pw/medium/4eece5be34e769d17229e643d3abf713.jpg" style="margin: 0; width: 100%;" alt="" />
<p style="font-size: 12px; margin: 0;">PikWizard</p>
</a>
</span>
</span>
Free (free of charge)
Free for personal and commercial use.
Author: Creative Art
Similar Free Stock Images

Premium


Premium


Premium


Premium


Premium


Premium


Premium


Premium


Premium


Premium


Premium


Premium


Premium


Premium


Premium


Premium


Premium


Premium


Premium


Premium


Premium


Premium


Premium


Premium


Premium