
- Home >
- Stock Photos >
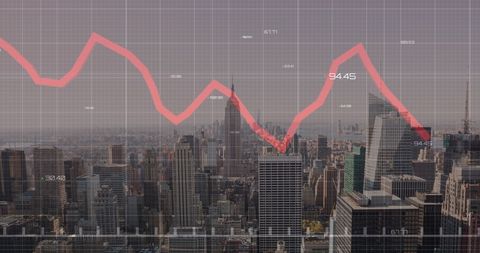
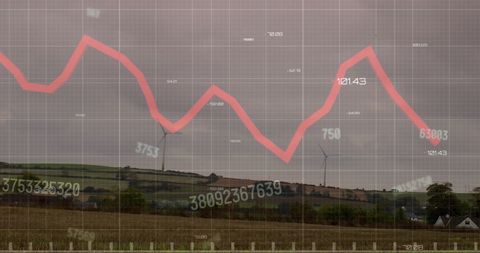
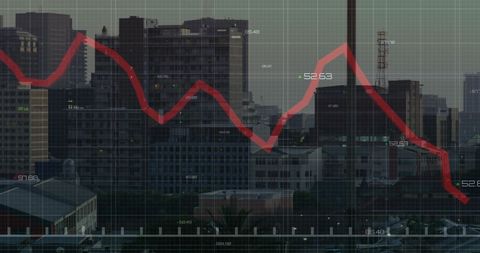
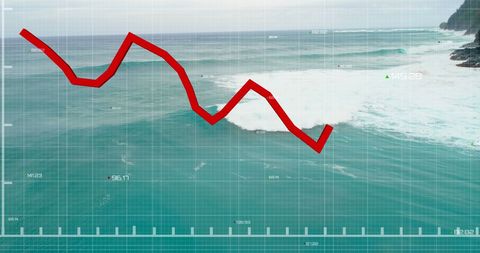
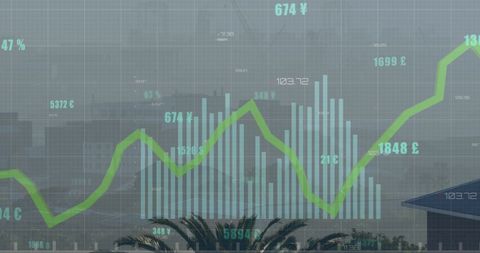
- Red Line Graph Overlay on Cityscape Represents Economic Trends
Red Line Graph Overlay on Cityscape Represents Economic Trends Image

Dynamic illustration of economic trends using red line graph overlay on a cityscape. Ideal for presentations on financial analysis, market forecasts and urban economic studies. Combine real-world context with abstract data visualization to support narrative on technological impact in urban finance, investments, and stock market.
Powered by  - Get 15% off with code: PIKWIZARD15


downloads
Tags:
More
Credit Photo
If you would like to credit the Photo, here are some ways you can do so
Text Link
photo Link
<span class="text-link">
<span>
<a target="_blank" href=https://pikwizard.com/photo/red-line-graph-overlay-on-cityscape-represents-economic-trends/bcf13d05468db93704da9a0d20085517/>PikWizard</a>
</span>
</span>
<span class="image-link">
<span
style="margin: 0 0 20px 0; display: inline-block; vertical-align: middle; width: 100%;"
>
<a
target="_blank"
href="https://pikwizard.com/photo/red-line-graph-overlay-on-cityscape-represents-economic-trends/bcf13d05468db93704da9a0d20085517/"
style="text-decoration: none; font-size: 10px; margin: 0;"
>
<img src="https://pikwizard.com/pw/medium/bcf13d05468db93704da9a0d20085517.jpg" style="margin: 0; width: 100%;" alt="" />
<p style="font-size: 12px; margin: 0;">PikWizard</p>
</a>
</span>
</span>
Free (free of charge)
Free for personal and commercial use.
Author: Creative Art
Similar Free Stock Images
Loading...

Premium


Premium

Premium

Premium


Premium


Premium


Premium


Premium


Premium

Premium

Premium


Premium

Premium

Premium

Premium


Premium

Premium

Premium


Premium


Premium

Premium


Premium

Premium


Premium


Premium

Explore More Free Stock Images