- Home >
- Stock Photos >
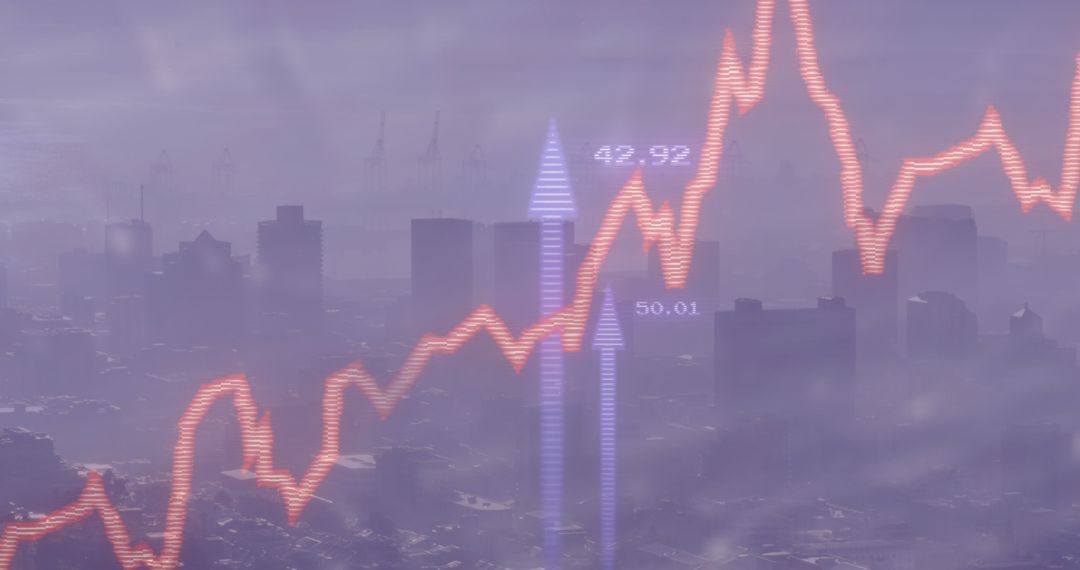
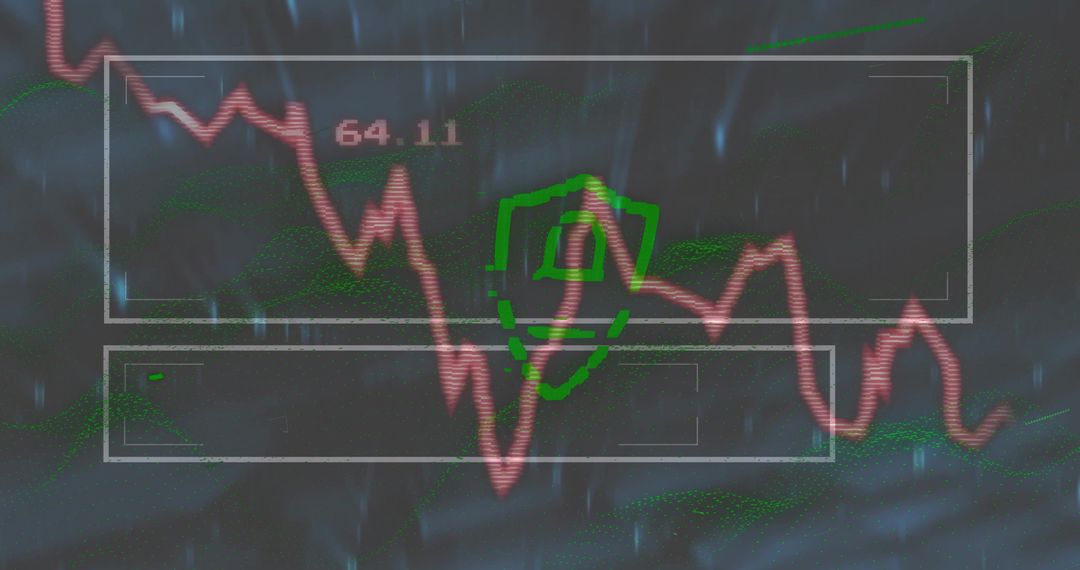
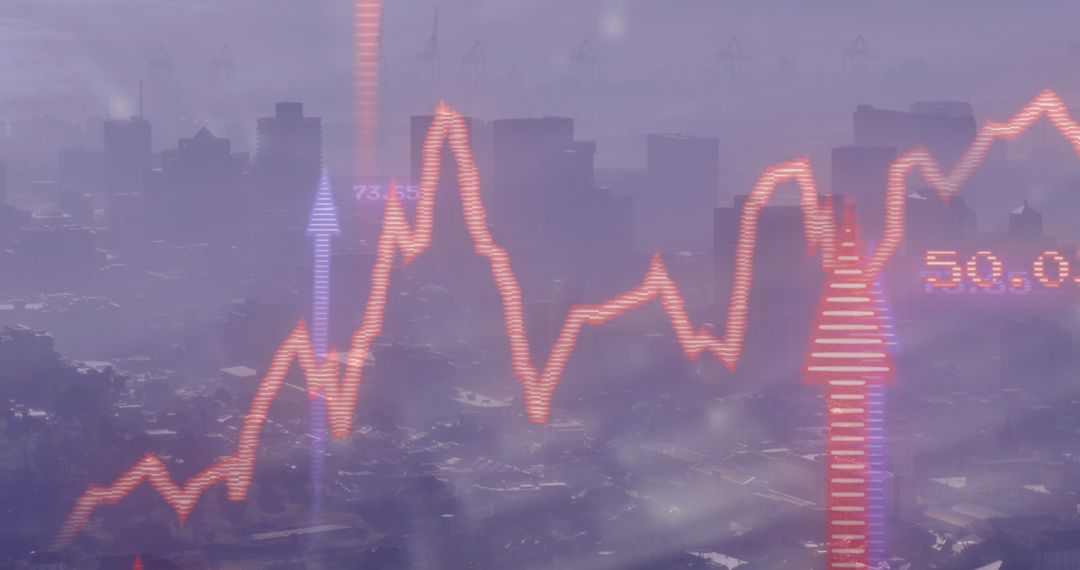
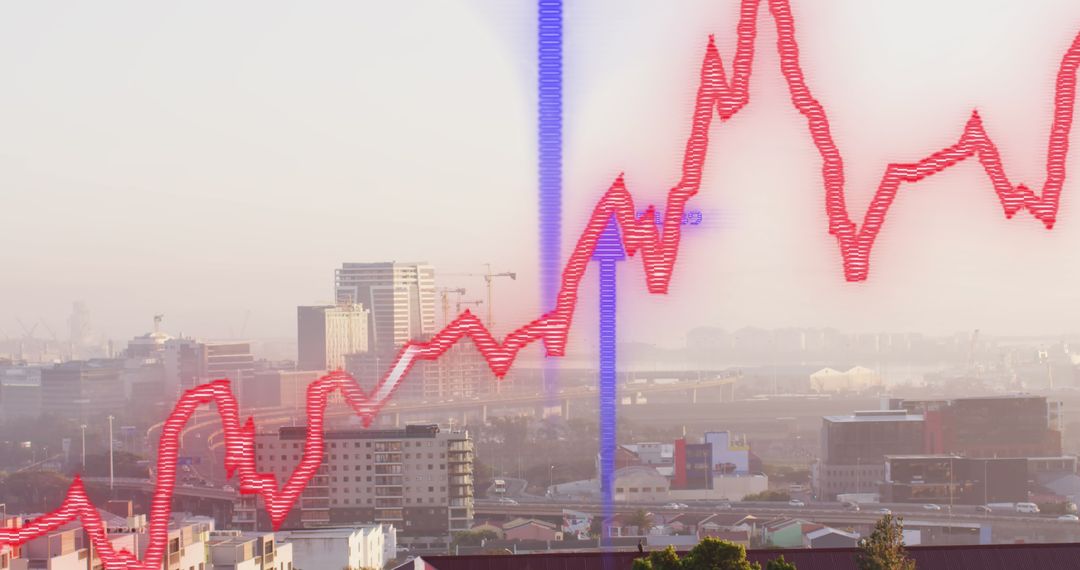
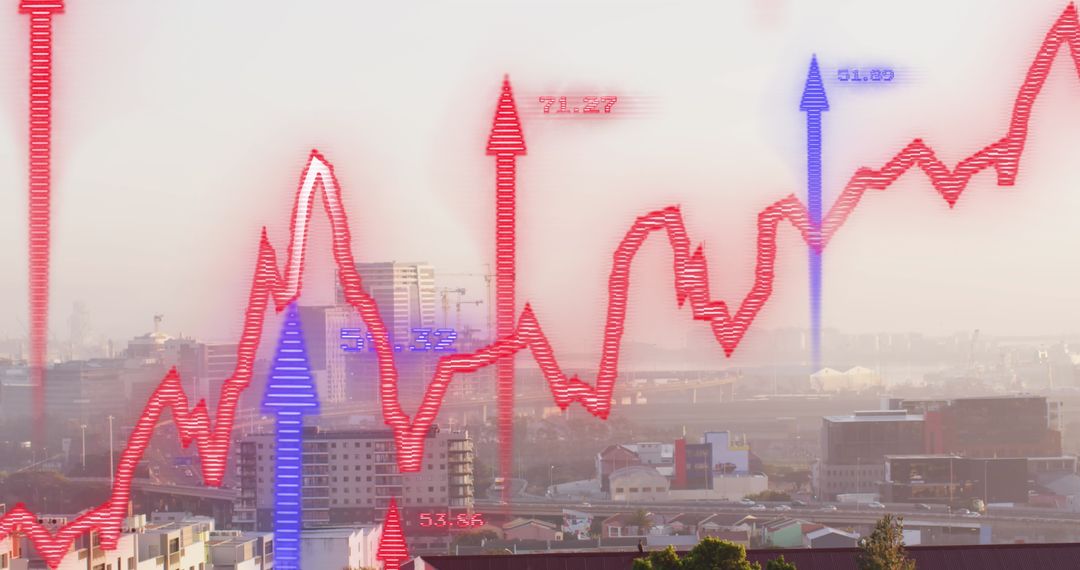
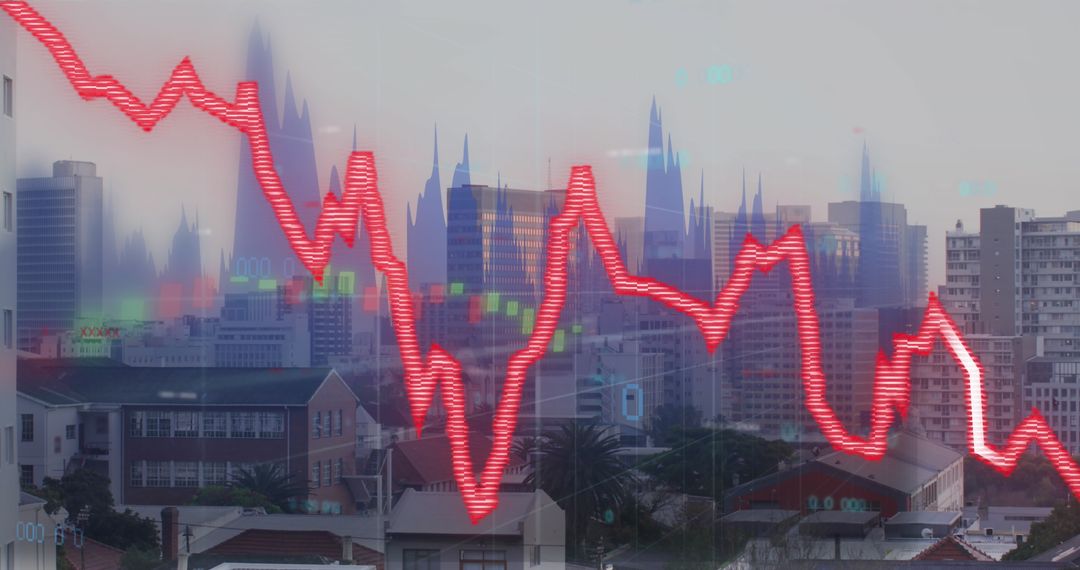
- Red Line Graph Overlay on Dusk Cityscape Displaying Financial Trends
Red Line Graph Overlay on Dusk Cityscape Displaying Financial Trends Image

This dynamic illustration features a red financial line graph overlaid on a cityscape at dusk, symbolizing market trends and investment growth. The digital chart is perfect for use in financial reports, business presentations, and articles discussing macroeconomic factors or investment strategies. The vibrant use of colors captures a futuristic and data-driven approach to urban economic development, making it an ideal visual aid to support analytics discussions or stock market news.
Powered by 


0
downloads
downloads
Tags:
More
Credit Photo
If you would like to credit the Photo, here are some ways you can do so
Text Link
photo Link
<span class="text-link">
<span>
<a target="_blank" href=https://pikwizard.com/photo/red-line-graph-overlay-on-dusk-cityscape-displaying-financial-trends/5691597b20eeacb6776fc2df6c8622ff/>PikWizard</a>
</span>
</span>
<span class="image-link">
<span
style="margin: 0 0 20px 0; display: inline-block; vertical-align: middle; width: 100%;"
>
<a
target="_blank"
href="https://pikwizard.com/photo/red-line-graph-overlay-on-dusk-cityscape-displaying-financial-trends/5691597b20eeacb6776fc2df6c8622ff/"
style="text-decoration: none; font-size: 10px; margin: 0;"
>
<img src="https://pikwizard.com/pw/medium/5691597b20eeacb6776fc2df6c8622ff.jpg" style="margin: 0; width: 100%;" alt="" />
<p style="font-size: 12px; margin: 0;">PikWizard</p>
</a>
</span>
</span>
Free (free of charge)
Free for personal and commercial use.
Author: Creative Art
Similar Free Stock Images

Premium


Premium


Premium


Premium


Premium


Premium


Premium


Premium


Premium


Premium


Premium


Premium


Premium


Premium


Premium


Premium


Premium


Premium


Premium


Premium


Premium


Premium


Premium


Premium