- Home >
- Stock Photos >
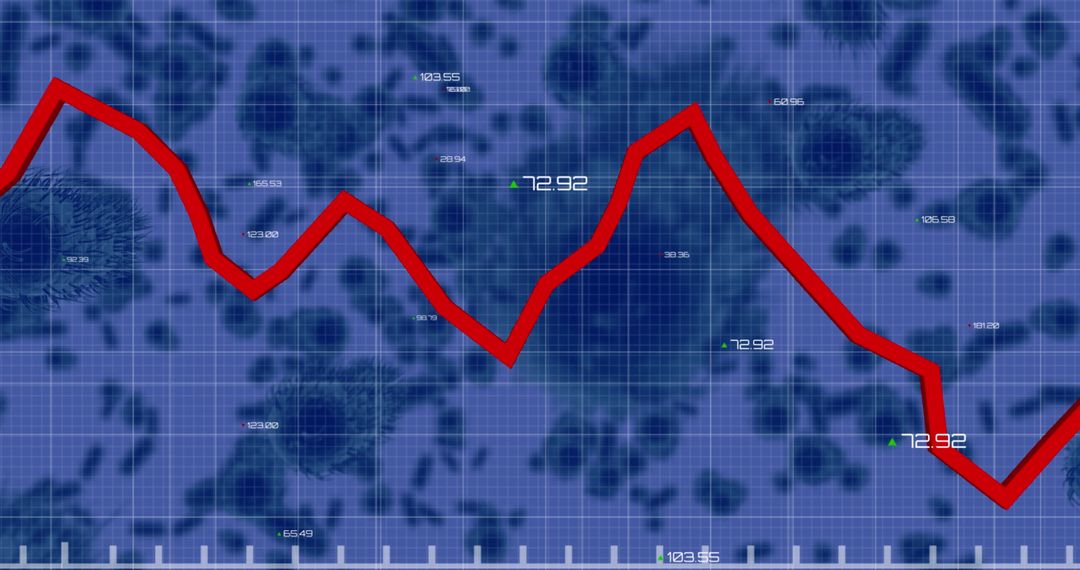
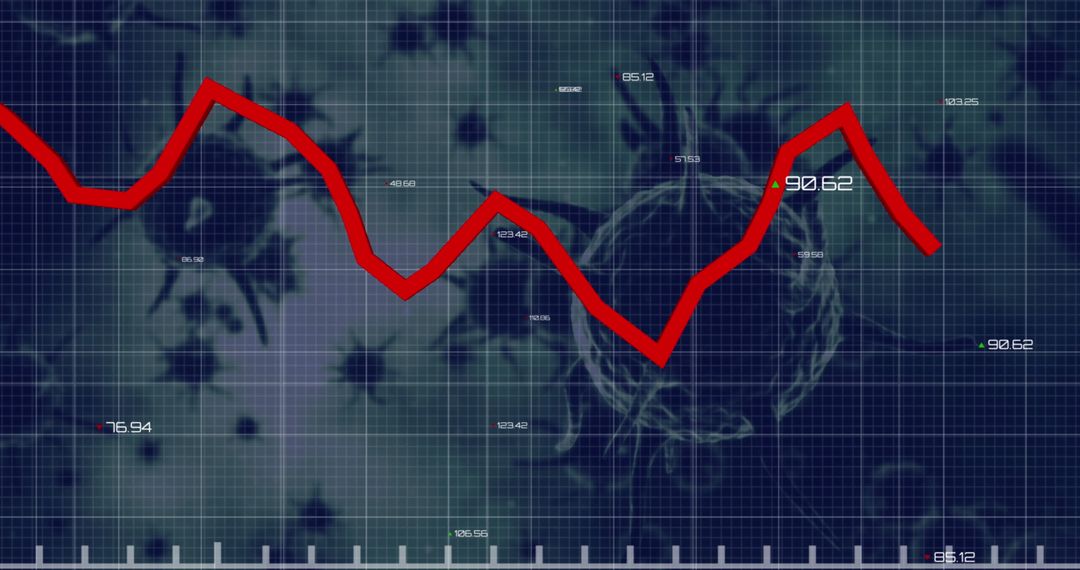
- Red Line Graph Overlay on Virus Micrograph Illustrating Data Trends
Red Line Graph Overlay on Virus Micrograph Illustrating Data Trends Image
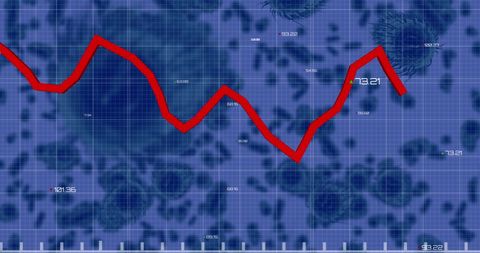
Red line graph superimposed on microscopic view of virus cells illustrates data processing and analytical trends in a biomedical context. Ideal for presentations on scientific research, data visualization, global health communication, and biotech analytics. Suitable for digital content related to pandemic studies, modern medicine, and technological impact on healthcare.

2
downloads
downloads
Tags:
More
Credit Photo
If you would like to credit the Photo, here are some ways you can do so
Text Link
photo Link
<span class="text-link">
<span>
<a target="_blank" href=https://pikwizard.com/photo/red-line-graph-overlay-on-virus-micrograph-illustrating-data-trends/449ebf8fcc9fec495b91326ff95dc85f/>PikWizard</a>
</span>
</span>
<span class="image-link">
<span
style="margin: 0 0 20px 0; display: inline-block; vertical-align: middle; width: 100%;"
>
<a
target="_blank"
href="https://pikwizard.com/photo/red-line-graph-overlay-on-virus-micrograph-illustrating-data-trends/449ebf8fcc9fec495b91326ff95dc85f/"
style="text-decoration: none; font-size: 10px; margin: 0;"
>
<img src="https://pikwizard.com/pw/medium/449ebf8fcc9fec495b91326ff95dc85f.jpg" style="margin: 0; width: 100%;" alt="" />
<p style="font-size: 12px; margin: 0;">PikWizard</p>
</a>
</span>
</span>
Free (free of charge)
Free for personal and commercial use.
Author: Creative Art
Similar Free Stock Images