
- Home >
- Stock Photos >
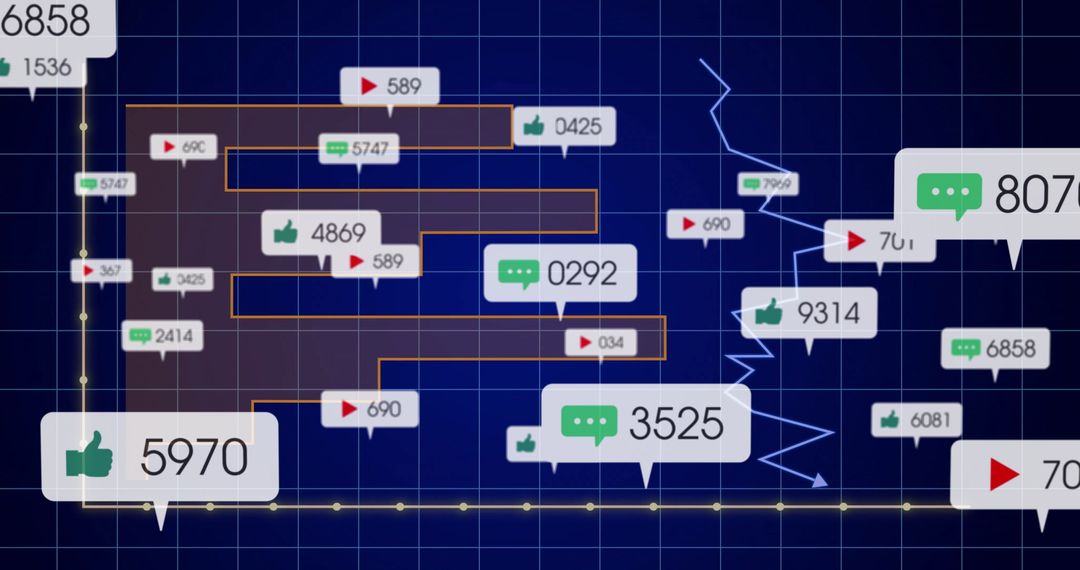
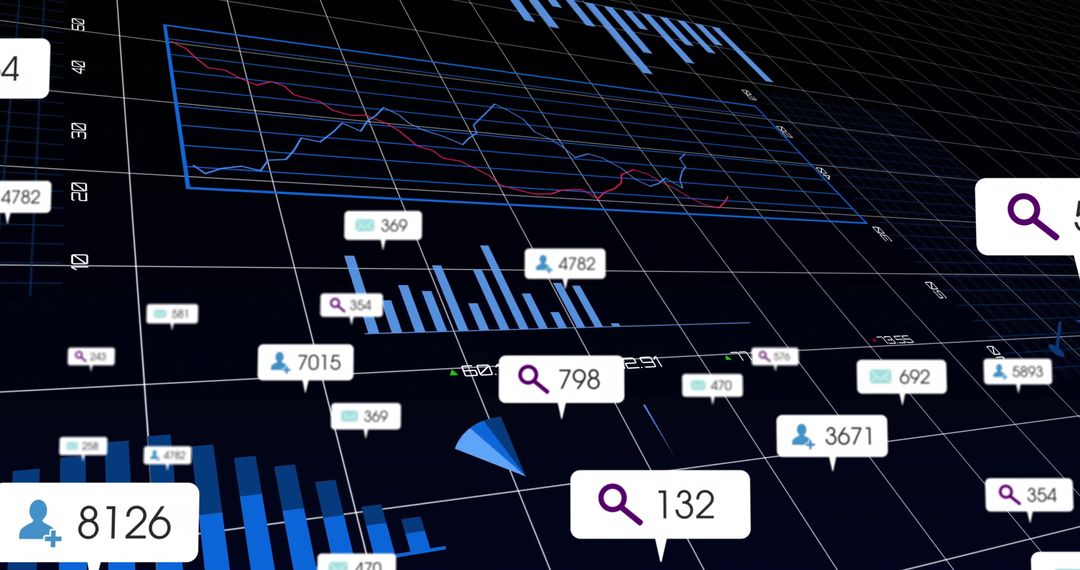
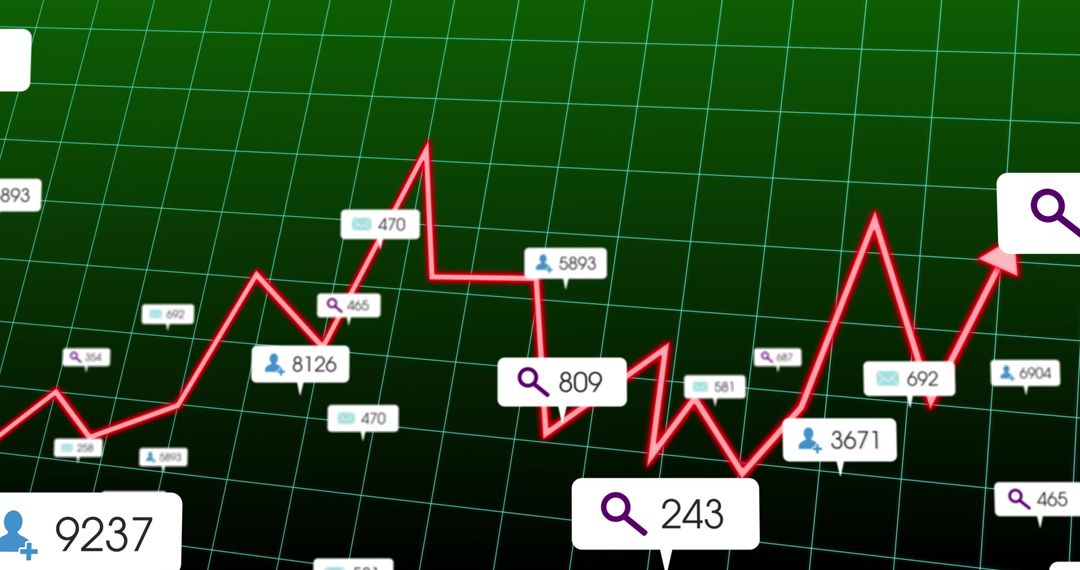
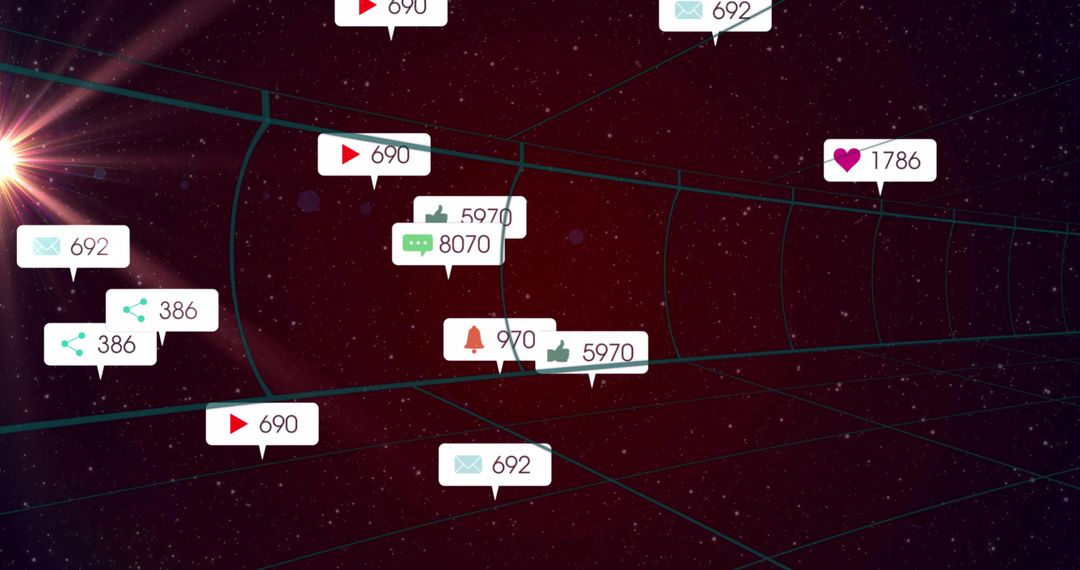
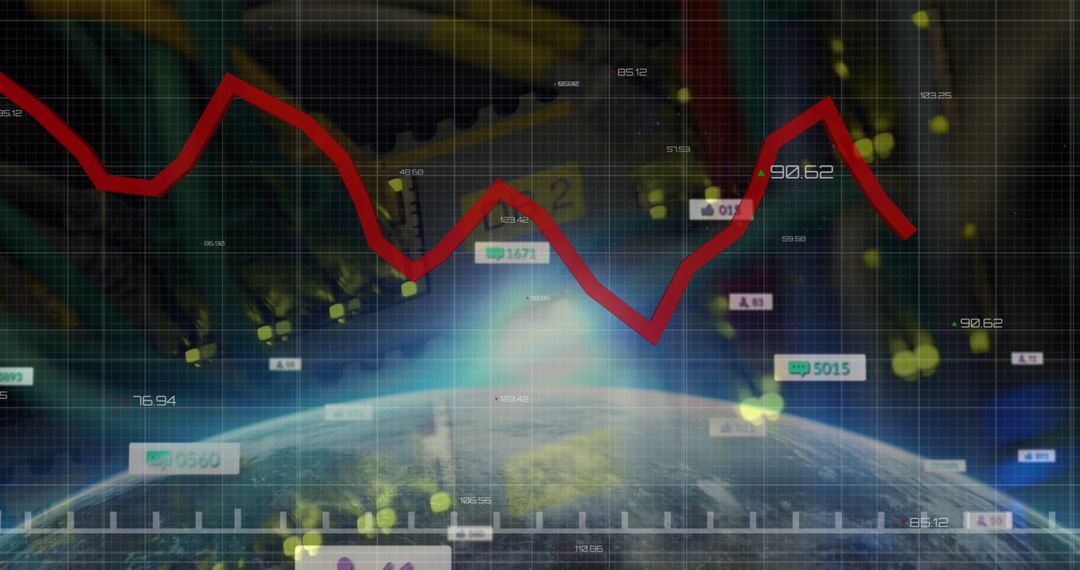
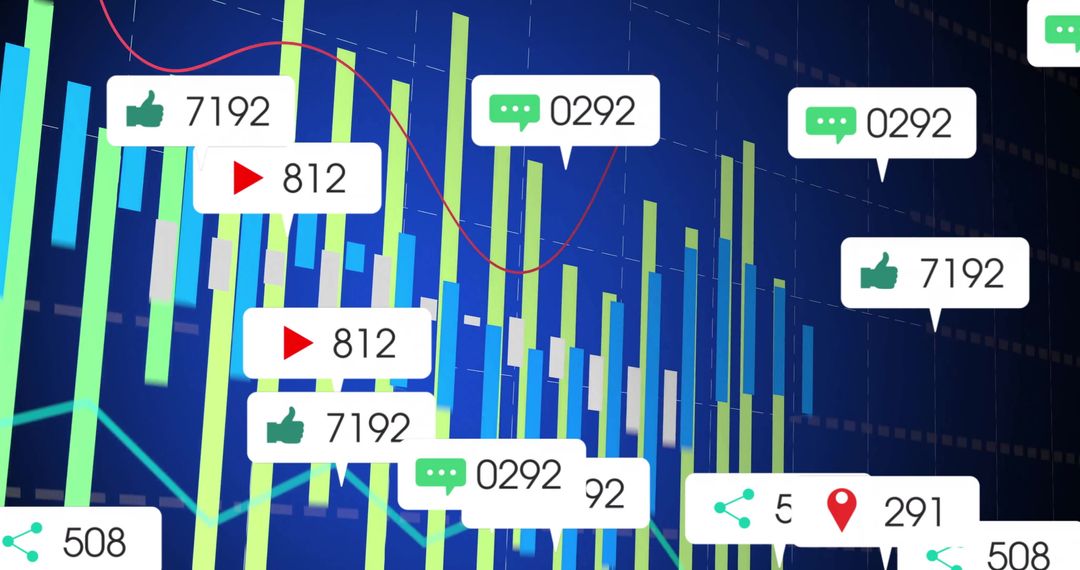
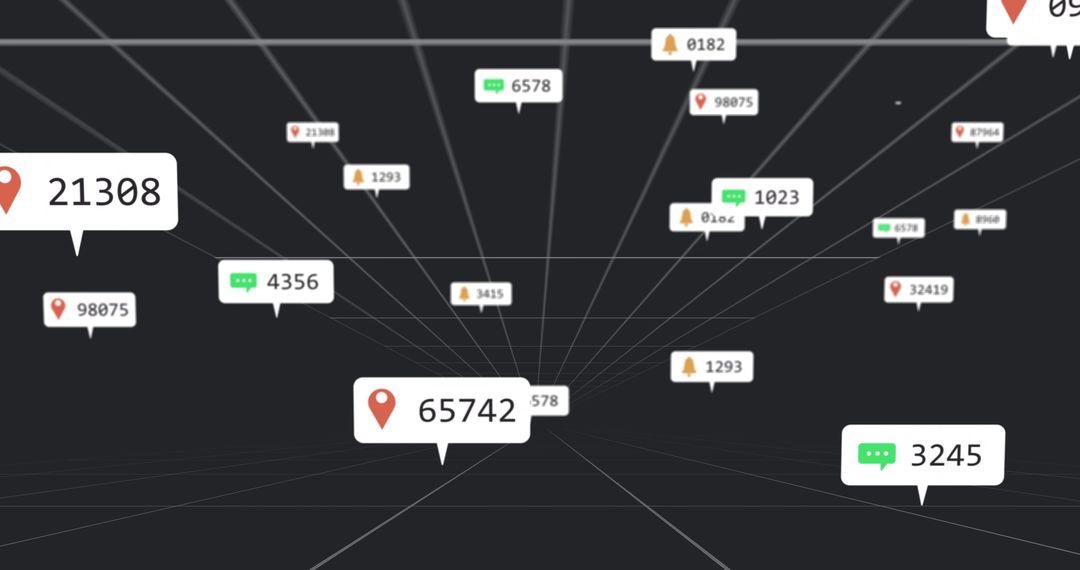
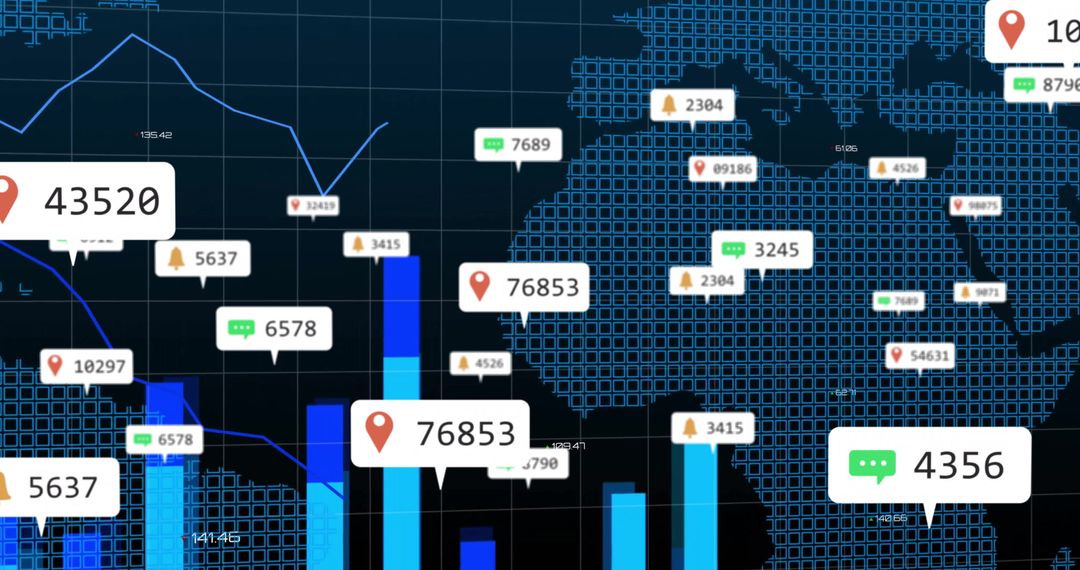
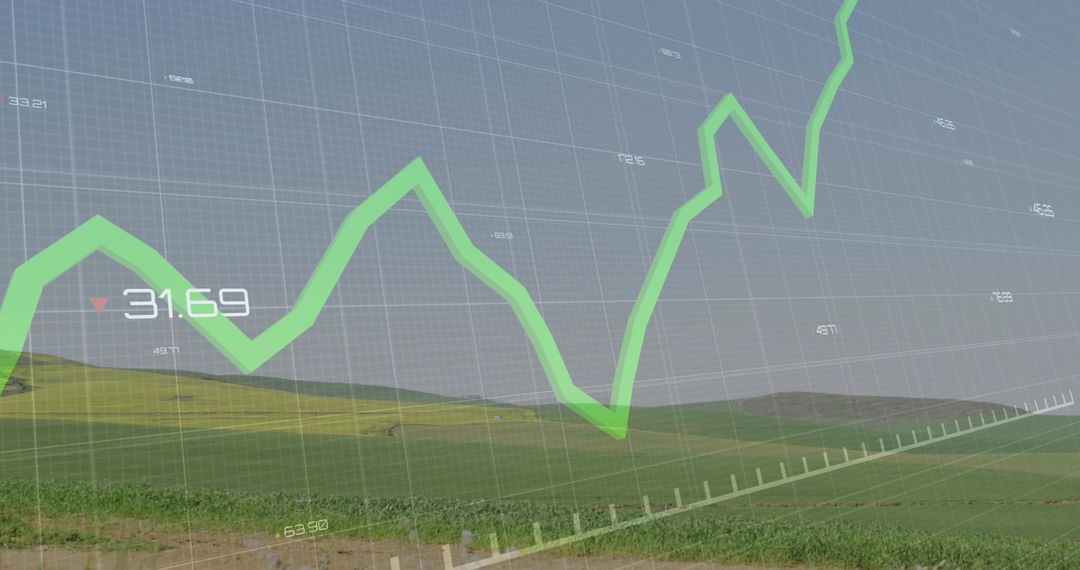
- Red Line Graph with Social Media Engagement Notifications
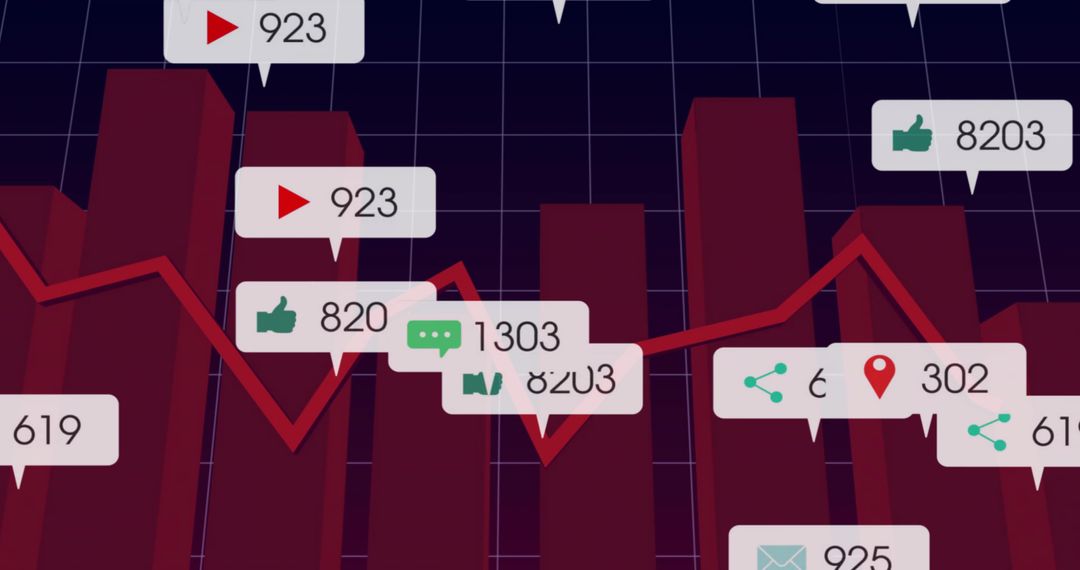
Red Line Graph with Social Media Engagement Notifications Image

Visualizing social media or business analytics with a dynamic red line graph featuring floating icons of likes and hearts, ideal for presentations on digital strategy, performance tracking in finance, technological advancements in data analysis, or promoting engagement statistics with client reports or marketing content.
Powered by  - Get 15% off with code: PIKWIZARD15


0
downloads
downloads
Tags:
More
Credit Photo
If you would like to credit the Photo, here are some ways you can do so
Text Link
photo Link
<span class="text-link">
<span>
<a target="_blank" href=https://pikwizard.com/photo/red-line-graph-with-social-media-engagement-notifications/1cbf84fceb5900ed60dc183cab1ba78d/>PikWizard</a>
</span>
</span>
<span class="image-link">
<span
style="margin: 0 0 20px 0; display: inline-block; vertical-align: middle; width: 100%;"
>
<a
target="_blank"
href="https://pikwizard.com/photo/red-line-graph-with-social-media-engagement-notifications/1cbf84fceb5900ed60dc183cab1ba78d/"
style="text-decoration: none; font-size: 10px; margin: 0;"
>
<img src="https://pikwizard.com/pw/medium/1cbf84fceb5900ed60dc183cab1ba78d.jpg" style="margin: 0; width: 100%;" alt="" />
<p style="font-size: 12px; margin: 0;">PikWizard</p>
</a>
</span>
</span>
Free (free of charge)
Free for personal and commercial use.
Author: Creative Art
Similar Free Stock Images

Premium


Premium


Premium


Premium


Premium


Premium


Premium


Premium


Premium


Premium


Premium


Premium


Premium


Premium


Premium


Premium


Premium


Premium


Premium


Premium


Premium


Premium


Premium


Premium

