1. Home > 
  2. Stock Photos > 
  3. Red Line Showing Decrease on Digital Grid with Hacker Background

Red Line Showing Decrease on Digital Grid with Hacker Background Image

Red Line Showing Decrease on Digital Grid with Hacker Background

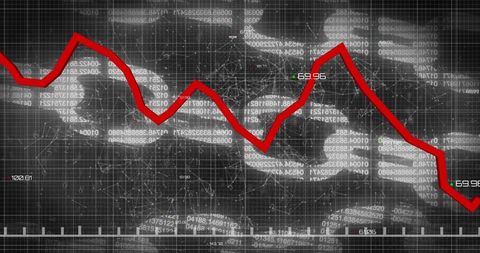
Features a prominent red line depicting a downward trend over a grid background filled with encrypted data, possibly suggesting a decline related to fiscal health, hacking, or cybersecurity breaches. Useful for illustrating stock market declines, highlighting cybersecurity risks, and for presenting technologies related to data analysis and network security issues.

Credit Photo

If you would like to credit the Photo, here are some ways you can do so

Free (free of charge)

Free for personal and commercial use.

Author: Creative Art

Similar Free Stock Images

Red Declining Graph on Digital Grid Display Represents Falling Markets
Dynamic Financial Graph with Changeable Metrics Over Green Line
Digital Currency Trading Interface with Data Visualization
Financial Graph and Cityscape Analysis with Technological Overlay
Fluctuating Financial Graph With Data Visualization
Futuristic Financial Graphs with Dynamic Green Line
Diverse Team Analyzing Financial Growth Chart in Conference
Financial Data Graph Over Urban Cityscape
Growth Trend with Green Line Overlay and Modern Cityscape
COVID-19 Data Analysis with Digital Graph Visualization
Declining Graph Overlay on Night Traffic Scene Illustrates Downtrend
Global Data Analysis with Digital Interface
Digital Interface Displaying Volatile Financial Market Analysis
Dynamic Financial Data Representation on Digital Grid
Financial Data Overlaid on Night Cityscape with Red Trend Line
Digital Financial Interface Over Cityscape
Computerized Analysis Over Futuristic Cityscape Background
Red Line Graph Overlay on Cityscape Represents Economic Trends
Business Growth Graphs Overlay Designer Creating Patterns
Dynamics of Financial Growth in Modern Business Setting
Dynamic Stock Market Graph Fluctuating in Modern Office
Colorful Financial Graphs on Digital Grid Background
Financial Market Decline with Red Line Graph Overlay
Stock Market Decline Data Analysis on Dark Grid Background
Global Financial Data and Social Media Escalation Chart
Digital Financial Data Chart with Modern City Skyscrapers
Financial Growth Graph Amid Urban Skyline Background
Red Graph Line Overlaying Cityscape Represents Market Trends
Dynamic Financial Data Visualization over Urban Silhouette
Declining Graph with 49% Reduction on Dark Digital Background
Digital Financial Data Analytics and Economic Trends
Businesswomen Analyzing Financial Downturn in Office Setting
Financial Data Growth Over Urban Cityscape with Graph Overlay
Financial Data over Wind Turbine Landscape Suggests Economic Trends
Rising Green Line Chart Overlays Concept of Financial Growth
Digital DNA and Data Analytics Fusion Visualization
Digital Lock with Real-Time Data Display
Downward Trending Graph with Office Background
Financial Growth Chart with Dynamic Green Line on Grid Overlay
Digital Security and Economic Networking Data Concept
Dynamic Financial Graph with Growth Patterns on Digital Screen
Businessman Analyzing Stock Market Data on Smartphone at Night
Digital Financial Report Analysis Overlaid on Office Scene
Dynamic Red Line Graph With Data Points on Gridded Background
Unattended Office with Financial Graph Overlay Concept
Colleagues Analyzing Stock Market Trends in Boardroom
Digital Financial Data Analysis with Futuristic Charts
Financial Data Analysis with Declining Trend on Blueprint Graph
Digital Decline Graphic with QR Code Elements and Red Line
Red Line Graph Overlaying Office Computers Symbolizing Data Analysis
Dynamic Graphs Depicting Financial Trends on Purple Grid Background
Financial Market Decline on Digital Screen With Red Line Graph
Financial Market Analysis Overlaying Urban Cityscape
Financial Graph Over Cityscape Depicting Data Trends and Analytics
Economic Trends Depicting Ukraine Crisis Concept
Green Line Rising on Digital Trading Board with Abstract Background
Diverse Female Colleagues Analyzing Market Trends on Laptop
Red Decline Line with Data Overlapping Server Room Background
Businesswoman Discussing Market Trends with Digital Chart Overlay
Green Financial Line Chart Over Modern Office Buildings
Financial Statistics Superimposed on 3D Model
Data Analysis and Cybersecurity Concept Art
Dynamic Financial Growth Graph on Blue Grid Background
Declining Financial Graph Over Data Grid with Global Background
Declining Stock Market Graph with Red Trend Line
Financial Data Graph Over Cityscape with Digital Overlay
Dynamic Red Line Graph on Digital Data Grid Background
Dynamic Financial Chart with Red Line Graph on Digital Interface
Green Graph Showing Forex Trends on Transparent Cyber Interface
Financial Chart with Falling Trends in Corporate Environment
Digital Interface Overlay Showing Economic Decline
Digital Interface with Overlapping Code and Graph
Fluctuating Financial Graph on Digital Orange Background
Financial Data Visualization with Declining Trend Line
Blueprint Analysis with Green Line Graph on Open Book
Dynamic Financial Data with Red Line on Digital Interface
Data Analysis Process with Green Digital Interface
Financial Data Chart Over City Silhouette
Red Line Graph Over Histogram Representing Financial Volatility
Descending Line Graph Over Urban Landscape Reflects Economic Trend
Graph Overlay on Business Meeting, Data Analysis Concept
Cryptocurrency Growth Chart Over Digital World Map
Financial Market Growth Over City Skyline
Declining Financial Market Chart Over Grid Background
Economic Growth Chart Over Urban Cityscape with Digital Interface
Digital Financial Data and Global Market Analysis on Graph
Financial Market Chart on Digital Screen Showing Growing Trends
Dynamic Data Chart on Dark Digital Background
Rising Chart Line Over Digital Grid Representing Financial Growth
Binary Code Financial Analytics with Rising Graph Line
Financial Data with Fluctuating Graph Lines on Grid Background
Digital Data Analysis over Cityscape Stock Market Concept
Digital Stock Market Graph with Abstract Coding Background
Futuristic Data Trend Graphs on Digital Interface
Fluctuating Stock Chart Overlay in Modern Office Environment
Colleagues Analyzing Data Trends in Modern Office Environment
Diverse Team Analyzing Data Trends with Digital Interface Overlay
Analyzing Growing Graph Line on Purple Gradient Background
Green Line Graph Overlaid on Empty Office with Data Overlay
Green 3D Line Chart Tracking Market Trends on Dark Grid Dashboard Interface Analytics